Introduction, Installation and Interface
This chapter is intended for users taking their first steps with the Mikrofab semiconductor / thin-film transistor (TFT) / photovoltaic (PV) measurement and analysis software. It provides a complete account of what the software is, who it is designed for, the system requirements, every step from installation through first launch, the licensing and update flow, and the overall architecture of the interface (the "shell"). Before the later chapters drill down into the individual measurement, analysis and calculation modules one by one, the goal here is for you to see the whole picture.
TFT Measurement App v<version> banner.This software is a laboratory tool that measures how a material or device sample (for example a transistor, solar cell or photodetector) "behaves" electrically and turns those measurements into meaningful numbers. Just as a doctor attaches electrodes to a patient, records an ECG, and then interprets heart health from that curve, this software applies controlled voltages to the sample, records the resulting current, and extracts from the curves the quantities that describe the device's quality. A typical study follows this chain: sample → measurement → analysis → report.
- Why it is done: To answer questions such as "Is this device working, how well does it work, and why did it fail?" with quantitative evidence.
- What it teaches / measures: The current-voltage behavior of the device and the characteristic quantities derived from it, such as threshold voltage, carrier mobility and efficiency; these are the device's "report card".
- Where it is used: Developing new materials in R&D, quality control in manufacturing, and failure analysis of defective devices returned from the field.
1. What Is the Software, and Who Is It For?
The Mikrofab measurement software is a standalone Windows desktop application that performs the electrical characterization of semiconductor/TFT/FET, photodetector, photovoltaic cell and related thin-film devices using multi-vendor Source-Measure Units (SMU). The software has two main axes of operation:
- Measure: Produces data directly from a connected instrument (or from the built-in simulation engine). It covers techniques such as the transfer curve, output (IV) curve, diode/Schottky characterization, four-point/van der Pauw resistance, pulsed IV, bias-stress/transient, hardware-triggered sweep, PV J-V, and recipe-based automatic sequencing.
- Analyze: Extracts physical metrics from a data file you load (a pure core independent of Qt,
app/analysis/). It requires no instrument; from a raw CSV/measurement file it computes quantities such as time response, PV metrics and photodetector parameters.
In addition, the Calc workspace lets you perform measurement-independent engineering calculations (for example van der Pauw sheet resistance) through a form; the Control workspace lets you drive a source with a timed ramp/step or temperature profile; the Journal/ELN (Lab Notebook) keeps sample-centric records; and Data and Reports archives, compares and generates customer-grade reports from all results.
Target audience:
| User profile | Typical use |
|---|---|
| Production/laboratory operator | Routine measurements with ready-made recipes/presets, simple interface |
| Device/process engineer (expert) | Access to all parameters, advanced sweeps, analysis, reporting |
| R&D / software developer | Python scripting (Script), headless automation, REST API |
2. Versions, Editions and Operating Modes
There is a "practice board" that lets you use the software from end to end even without a real measurement instrument (SMU) connected: Simulation (Mock) Mode. In this mode the software produces consistent fake data as if it came from a real device; just as a flight simulator trains a pilot without a real aircraft, you too can try out all the screens, measurements and reports without taking any hardware risk.
- Why it is done: To learn without (or before obtaining) an instrument, to provide training, and to safely rehearse a recipe/flow before a real measurement.
- What it teaches / measures: Exactly the same interface and file output as a real measurement; the only difference is that the data is fake (but physically plausible).
- Where it is used: First familiarization and training, demo/presentation, and a setup test before moving to a real instrument.
The software is distributed as a single application; the "edition" difference arises through the license and the user mode:
| Mode / state | Real-instrument measurement | Simulation | Analysis / Calc | Description |
|---|---|---|---|---|
| Simulation (Mock) Mode | — | Unlimited | Unlimited | Fully functional trial without hardware; on by default |
| Unlicensed trial | 5 measurements (lifetime) | Unlimited | Unlimited | 5 free measurements on a real instrument |
| Licensed | Unlimited | Unlimited | Unlimited | Hardware unlocked (hardware feature) |
- Simulation Mode (Mock Mode) is on by default (
mock_mode: true). In this mode the software starts without needing a real instrument, produces fake but consistentIds/Igsdata, plots graphs and saves to file. - Headless (no GUI) operation: a measurement sequence can be run without the GUI via
python main.py --headless --job <file>; in addition, automation/remote control is possible through a local REST API server (--serve 8765).
%PUBLIC%, %LOCALAPPDATA% and the configuration file; it is not reset even if you uninstall and reinstall the software (or even if %APPDATA% is deleted). Simulation Mode is always unlimited.3. System Requirements
| Component | Requirement | Note |
|---|---|---|
| Operating system | Windows 10 / 11 (64-bit) | The installer is for Windows |
| Python (running from source) | 3.13 recommended, 3.9+ supported | Python is not needed if you use the packaged .exe |
| GUI library | PySide6 (Qt 6) | matplotlib + optional pyqtgraph (PV) |
| VISA layer (real instrument only) | NI-VISA, Keysight IO Libraries or R&S VISA | Not needed in simulation mode |
| Connection | GPIB/USB(USBTMC)/LAN for the SMU; COM (serial) for the Switch Matrix | — |
| Disk / RAM | ~500 MB free space; 4 GB+ RAM | The data folder grows as the number of measurements increases |
openpyxl is used for Excel (.xlsx) export; if it is not installed, the software produces a minimal Excel file using the standard Python library. Offline license signature verification requires the cryptography library; if it is not installed the application still starts, it simply falls back to unlicensed mode.4. Installation
4.1 Using the installer — the recommended path
For end users the easiest path is the ready-made NSIS 3-based installer. This file includes the license text in both English and Turkish and packages Python and all dependencies.
- Download the most recent
Mikrofab-Suite-<version>.exeinstaller fromdownload.mikrofab.com. - Double-click the file and follow the setup wizard (accept the license agreement, choose the installation folder).
- When installation finishes, launch TFT Measurement App from the Start menu or the desktop shortcut.
.exe shows a splash screen before the Python interpreter and the heavy libraries are loaded; this gives a "loading" impression and removes the need to click repeatedly.4.2 Running from source — developer/advanced user
For developers and custom installations the software can be run directly from source (Windows PowerShell):
py -3.13 -m venv .venv
.\.venv\Scripts\Activate.ps1
python -m pip install --upgrade pip
pip install -r requirements.txt
python main.py
On first launch Simulation Mode is on; the application runs without hardware. For unit tests, run python -m pytest after pip install -r requirements-dev.txt.
C:/Users/<user>/Mikrofab folder. This location is deliberately kept outside OneDrive and Documents, directly in the user profile; because during conflict resolution OneDrive synchronization continually renames the folder to something like Mikrofab-<COMPUTER>, making it appear as if a new folder is created each session. If the path is set to a synchronized location, the software automatically moves it outside OneDrive.5. First-Launch Flow
On first launch the following happen in order:
- The version banner is printed to the terminal (
TFT Measurement App v5.85.0). - The splash screen appears. The lower-left shows the version (
vX.Y.Z) and the abbreviated machine ID (ID: MF-...), the lower-right shows thesuite.mikrofab.comandmikrofab.comaddresses, and the center shows progress text (Starting…,Loading interface…). - The configuration is read, the language is set, and the embedded fonts (Inter / JetBrains Mono / Geist) are loaded.
- The main window is built and brought to the front (on Windows it is briefly made TOPMOST to overcome the foreground lock).
- About 1.2 seconds after launch (if this is the first run), the privacy/telemetry consent screen (onboarding) is shown — see §6.
6. Onboarding and Privacy Consent (Telemetry)
Telemetry is the software feeding back anonymous hints about its own usage (for example which feature ran, or how a crash occurred) to the developer; its purpose is to improve the software over time. Think of it like a car's "check engine" warning light carrying information to the service center — but here you decide entirely what is shared, and your raw measurement data is never sent.
- Why it is done: To catch errors early and to improve the software based on the features that are actually used.
- What it teaches / measures: Only anonymous usage/crash/performance signals; it offers a consent table that you can toggle category by category.
- Where it is used: Compliance with corporate privacy policies (off by default in the EU/Turkey) and the decision on responsible data sharing.
On first launch (or when the consent schema is updated) a granular consent dialog opens. Until a decision is made on this screen, telemetry is off.
Consent categories:
| Category | Description | Recommended |
|---|---|---|
| Crash reports (crash) | Diagnosis of application crashes | Yes |
| Usage (usage) | Which features are used (anonymous) | Yes |
| Device (device) | Connected device model/manufacturer class | Yes |
| Performance (performance) | Startup/operation times | Yes |
| Device firmware (device_firmware) | Firmware version information | No |
| Error trace (error_trace) | Detailed error stack | No |
Three buttons are offered:
- Accept All — checks all boxes and saves (the default/recommended button).
- Save My Choice — saves the selection you made in the boxes.
- None For Now — turns off all categories.
7. License Activation and Machine ID
The license is a digital key that unlocks the right to perform unlimited measurements with a real instrument; Simulation, analysis and calculation work even without a license. Each computer generates a unique, stable "Machine ID" and the license binds only to that machine; just as a plane ticket is valid only for a single passenger and seat, the key will not work on another machine.
- Why it is done: To authorize commercial use of the software and to limit real-instrument measurement to authorized machines only.
- What it teaches / measures: The information "Is this copy active, on which machine, until when, and which features are unlocked?"; verification is offline and signature-based.
- Where it is used: Activation after purchase, license renewal, and managing multiple laboratory machines.
The software requires a license for measurement with a real instrument; Simulation Mode, analysis and calculation work even without a license. License verification is performed offline: the license key is signed on the server with a secret Ed25519 private key, and the client verifies the signature only with the public key embedded in the software. The private key is never present on the client.
7.1 Machine ID
A stable identifier unique to each computer is generated:
Raw source  ->  strip + lower  ->  SHA-256  ->  first 12 hex digits
result format: MF-XXXX-XXXX-XXXX- Input (Windows): The
MachineGuidin the registry (HKLM\SOFTWARE\Microsoft\Cryptography). - Input (Linux):
/etc/machine-idor/var/lib/dbus/machine-id; if absent,platform.node(). - Output:
MF-XXXX-XXXX-XXXX(for exampleMF-1A2B-3C4D-5E6F). - Stability: Does not change across sessions and installations; uses only the standard library and never throws an error.
The first 8 digits of the ID are displayed on the splash screen, and the full ID is shown under Settings → Account & License with a "Copy" button.
7.2 Activation steps
- When you connect to a real instrument and your trial allowance (5 measurements) is exhausted, or manually from Settings, the License Activation dialog opens.
- Copy the Machine ID from the dialog and send it to the developer/vendor.
- Receive your unique long License Key (in the
PAYLOAD.SIGNATUREformat) and paste it into the box. - Press Activate. If the key belongs to this machine and this application (
app_id = tft-measurement), is not expired and has a valid signature, the license is accepted and saved permanently.
The license file is stored at the following location:
%LOCALAPPDATA%\Mikrofab\TFT Measurement App\license.key| License field | Meaning |
|---|---|
m | Machine ID (must match this machine) |
a | Application ID (tft-measurement) |
f | List of unlocked features (e.g. hardware) |
e | Expiry date (YYYY-MM-DD) or perpetual (empty) |
8. Automatic Update
The software checks by itself whether a newer version has been released, by reading a version list (manifest) on the internet, and downloads the new installation with your approval. It works like the "update available" notification of phone apps; the downloaded file is verified with a fingerprint (SHA-256) to make sure it was not corrupted in transit.
- Why it is done: So that you receive bug fixes and new features safely, without manual effort.
- What it teaches / measures: Whether the running version is up to date; it provides integrity verification and resumable downloads.
- Where it is used: To ease maintenance and to keep all laboratory machines on the same, known-good version.
The software checks for updates at launch and manually from the Help menu:
| Parameter | Unit | Description | Default |
|---|---|---|---|
update_check_enabled | bool | Whether the automatic update check is on | true |
update_manifest_url | URL | Address of the version manifest (latest.json) | https://download.mikrofab.com/suite/latest.json |
update_check_interval_hours | hours | Minimum time between two checks | 24 |
update_timeout_s | s | Network timeout | 8.0 |
update_skip_version | text | Version marked "skip this version" | — |
How it works:
- The software reads the
latest.jsonmanifest (cache-busting, fresh read). - If the
versionin the manifest is newer than the current__version__, an update is announced. - If you approve, the installer is downloaded; if the manifest contains
sha256, the download undergoes SHA-256 integrity verification. - The download can resume from where it left off (HTTP Range); on a slow/intermittent connection it is retried up to 5 times.
9. Interface Tour: The Shell Architecture
The application window is built on a modern "shell" architecture. It consists of three main regions:
- Left rail (workspace rail): The vertical icon strip used to switch between workspaces (width 96 px).
- Center stack: The page of the selected workspace (card gallery, cockpit, table, etc.) or a module's detail view.
- Top device bar: The global search box, the Application (family) filter, the command palette button (
⌘K) and the EMERGENCY STOP (E-STOP) button.
9.1 The Left Rail and Workspaces
The icon strip on the left edge divides all of the software's functions into separate "rooms" according to their tasks: taking measurements, analysis, calculation, the data archive, hardware management and more. Like the floor plan of a hospital divided into departments, you switch to whichever workspace matches the job at hand; this way the interface stays uncluttered and each task remains in its own place.
- Why it is done: To divide a multi-function software into understandable work areas so you can quickly find the right tool.
- What it teaches / measures: Where each step of a typical workflow (Measure → Analyze → Data and Reports) is carried out.
- Where it is used: Switching from one task to another in daily work; working with only the areas you need according to your role.
The rail contains 11 workspaces in order. The icon of the selected item is painted in the accent color, the others in a muted color; a 3 px accent bar appears on the left edge of the selected item.
| # | Workspace | Icon | Content |
|---|---|---|---|
| 1 | Home | home | Cockpit: greeting, quick start, favorites, recent activity, hardware status, tips |
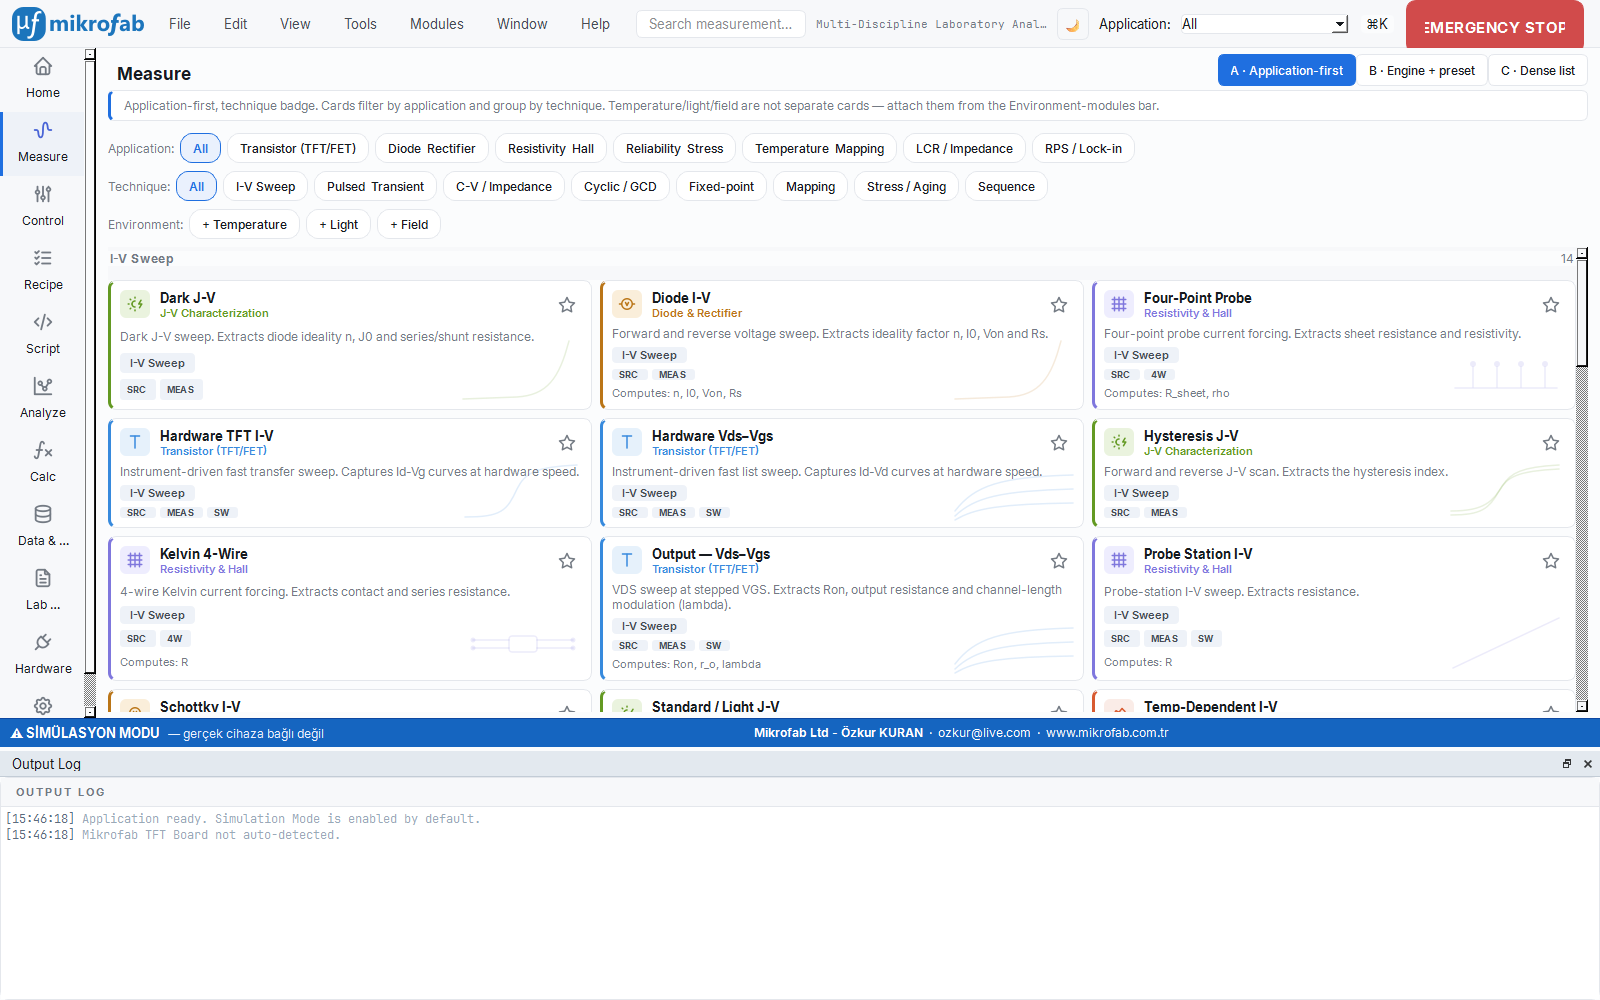
| 2 | Measure | wave-sine | Live measurement workspace (technique panel + preset gallery) |
| 3 | Control | adjustments | Driving a source with a timed set-point / temperature profile |
| 4 | Recipe | list-check | Recipe (sequential automation) viewer/loader |
| 5 | Script | code | Python scripting console + editor + flow diagram |
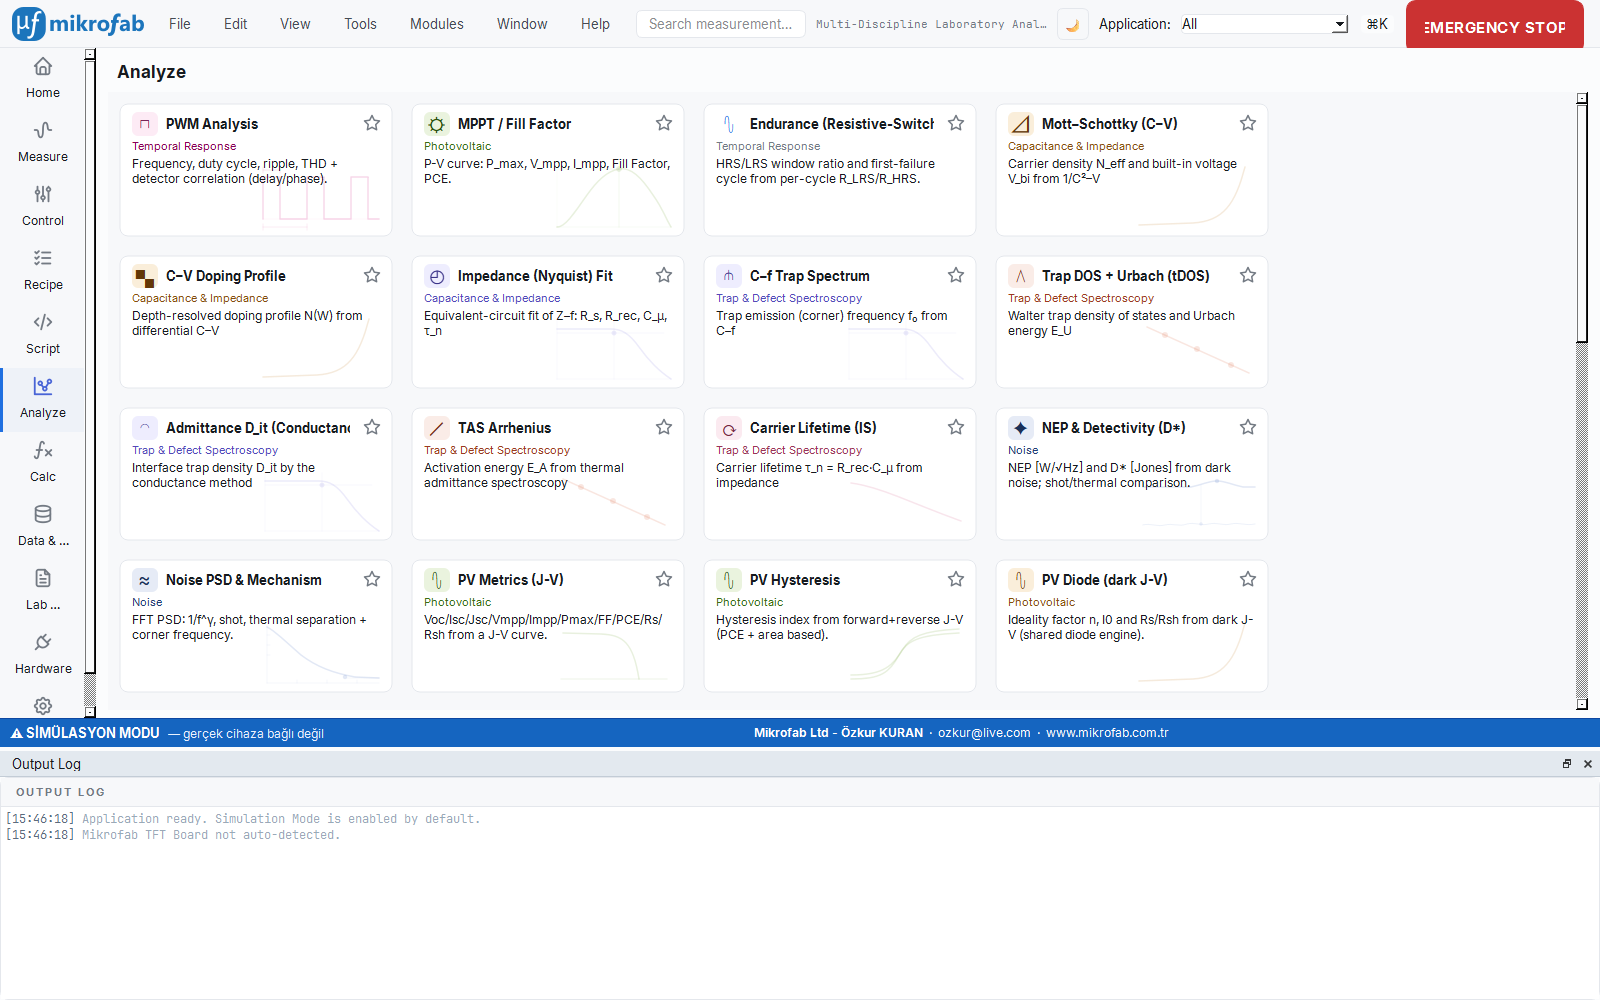
| 6 | Analyze | chart-dots | Analysis modules that extract metrics from files |
| 7 | Calc | math-function | Form-based engineering calculations (e.g. sheet resistance) |
| 8 | Data and Reports | database | Archive, library, statistics/SPC, comparison, report builder |
| 9 | Lab Notebook | file-text | Sample-centric electronic laboratory notebook (ELN) |
| 10 | Hardware | plug | Device inventory, role mapping, profiles, EMERGENCY STOP |
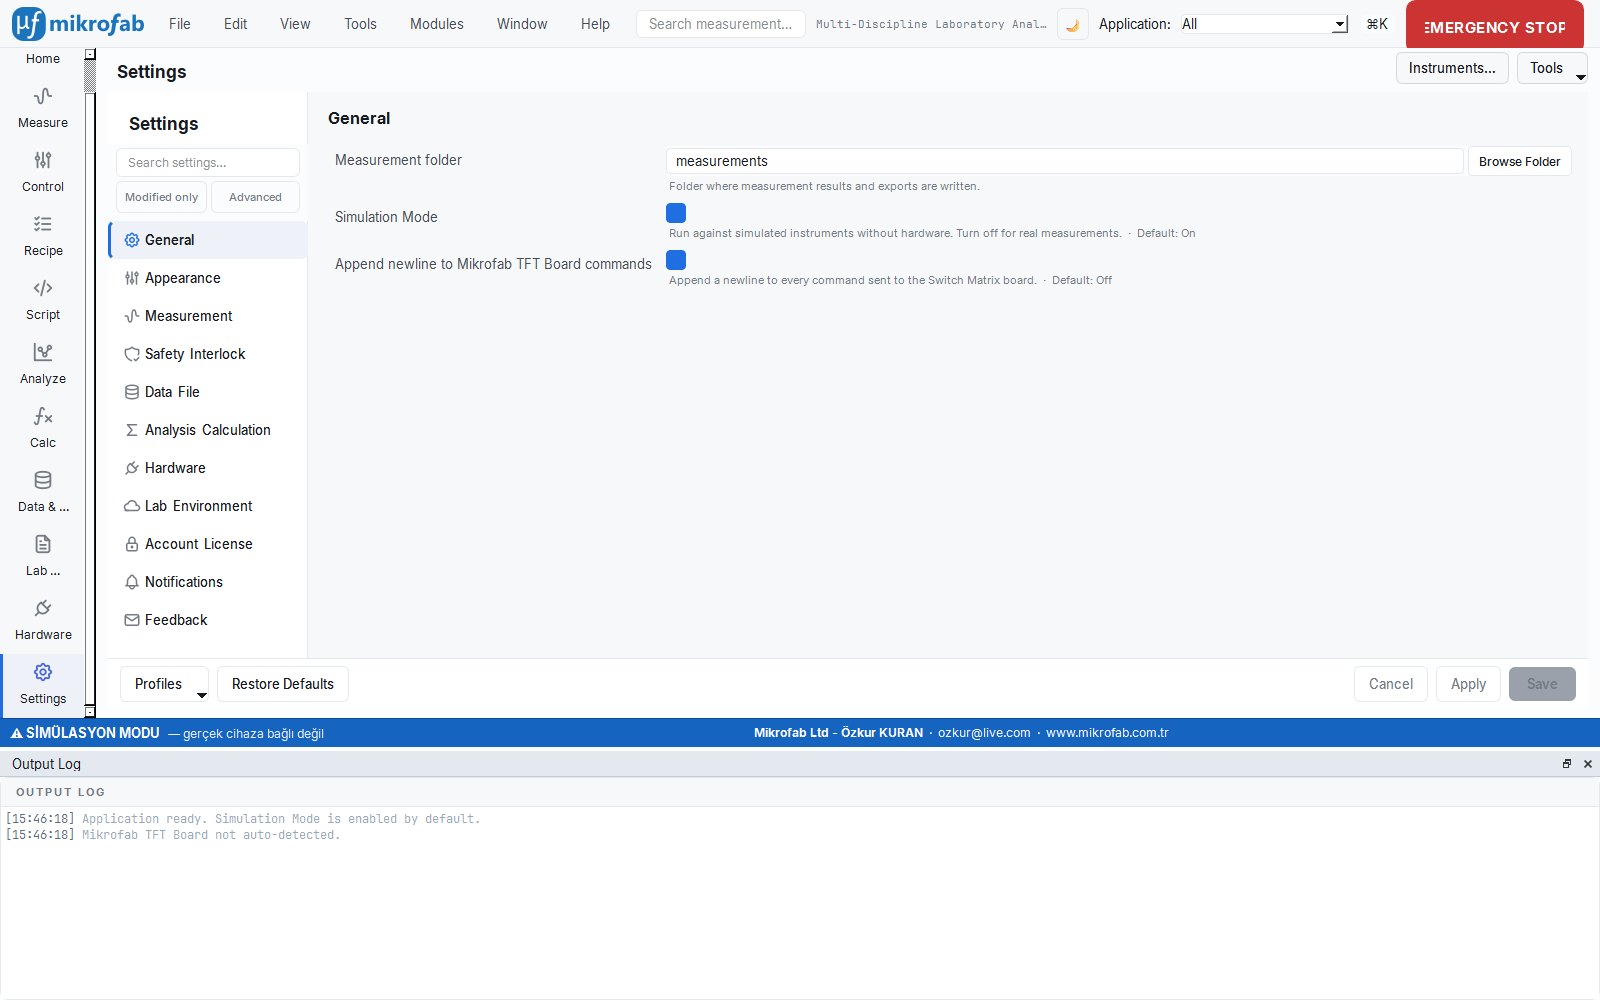
| 11 | Settings | settings | All configuration (appearance, language, measurement, security, data, license…) |
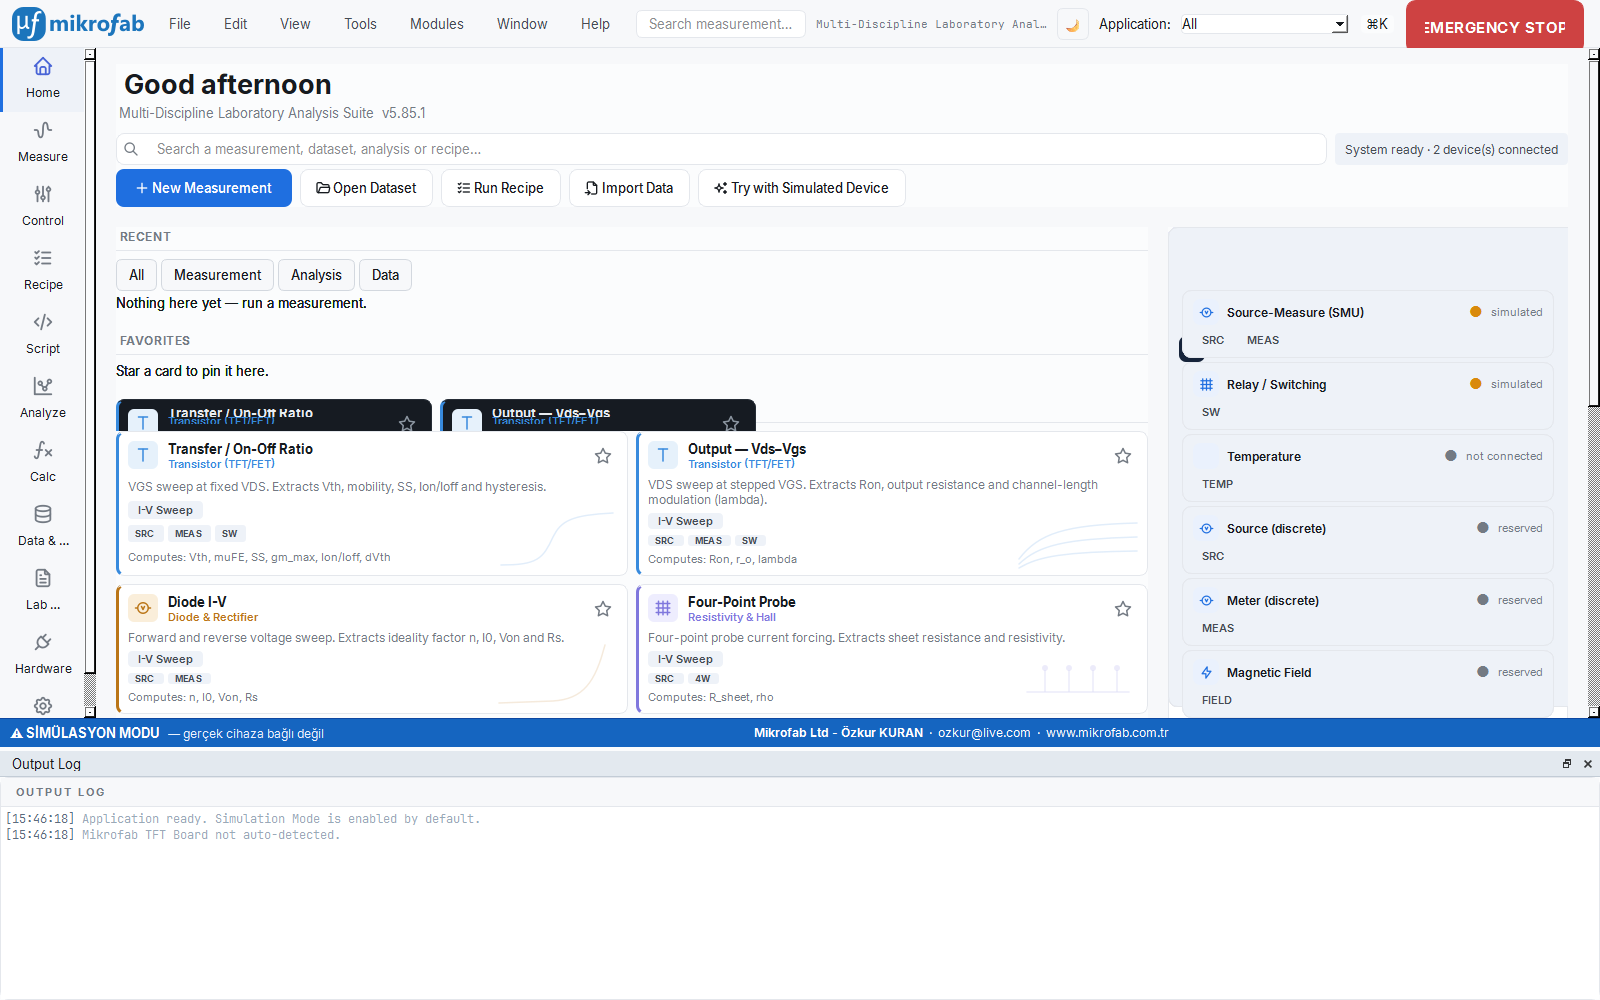
9.2 The Home Cockpit
The Home page is a two-column cockpit dashboard:
- Top (hero) strip: A time-aware greeting (Good morning / Good afternoon / Good evening), the product slogan + version, a search box that opens the command palette when clicked, a system status badge, and action buttons (New Measurement, Open Dataset, Run Recipe, Import Data, Try with a Simulated Device).
- Left column: Recent activity (filtered with the All / Measurement / Analysis / Data tabs), favorites, quick-start cards.
- Right column: The active measurement job card (shown while running), the outdoor ambient card (if enabled), the System and Hardware summary, start tiles by discipline, and tips.
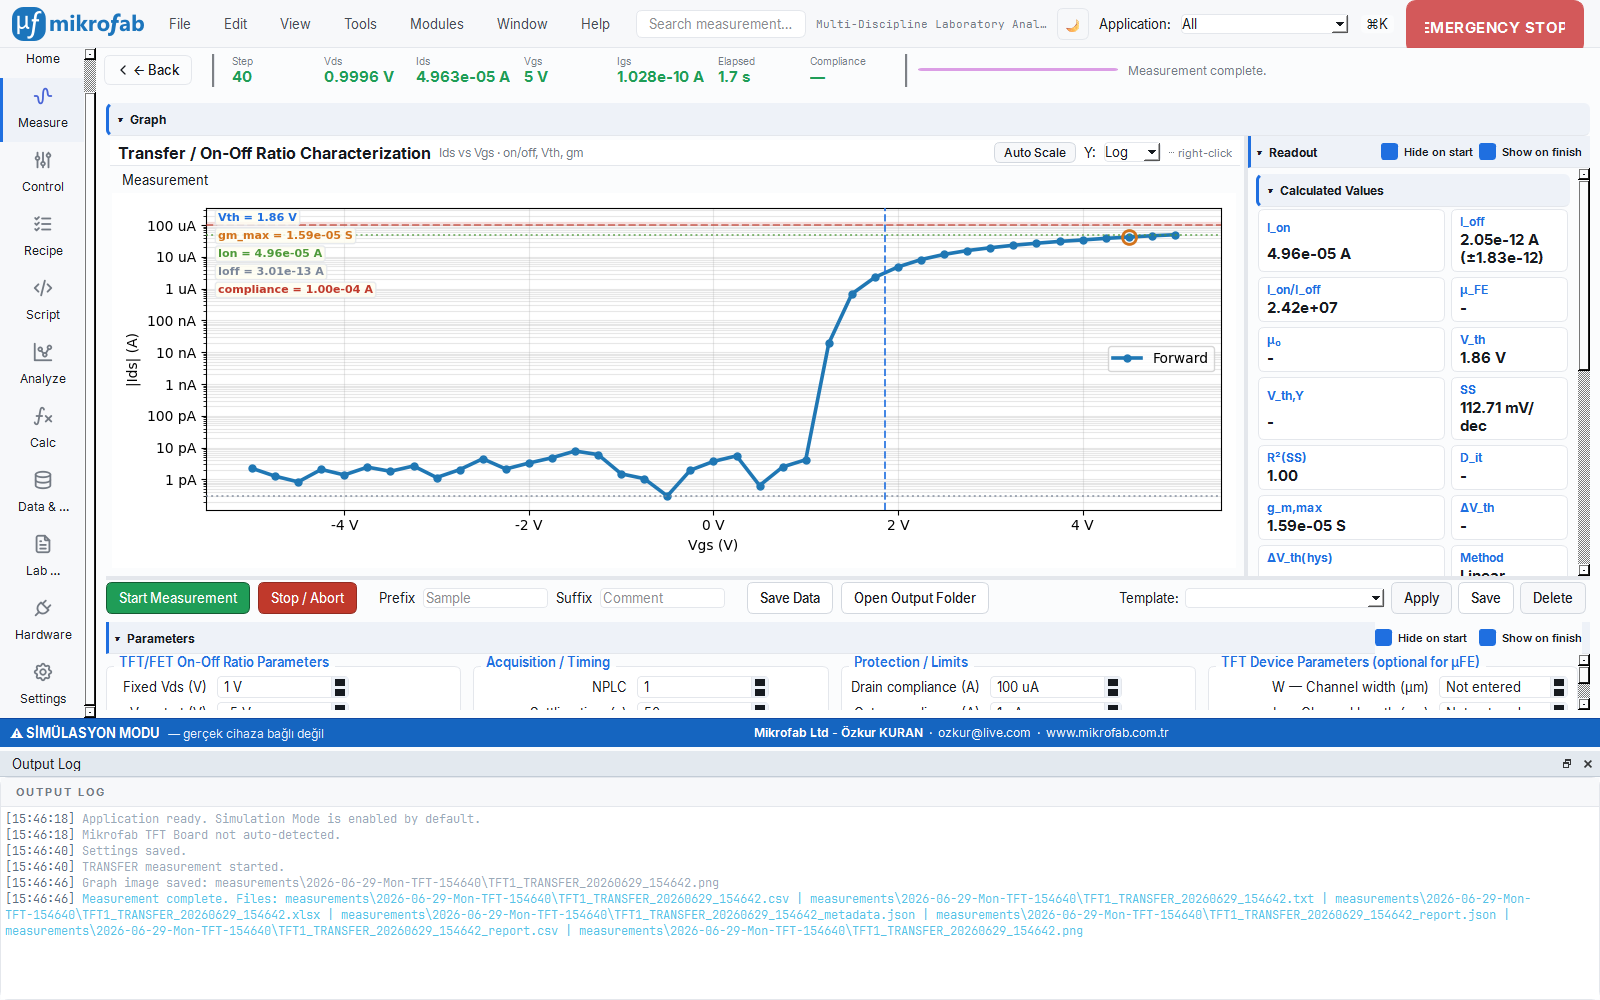
9.3 The Detail View (Opening a Module)
When you click a measurement/analysis card, the detail view of the corresponding module opens. At the top of the detail view there is a breadcrumb (e.g. Measure › Transfer) and a Back button. The module panel (parameters, live graph, readout area) lives inside this view.
10. Top Search and Command Palette
This is a quick-access tool that lets you find the measurement, analysis or workspace you are looking for by typing its name, without navigating through menus. Like typing a book's title into the search catalog instead of walking shelf by shelf in a library, with Ctrl+K you reach everything instantly; and it does not matter whether you type in Turkish or English.
- Why it is done: To jump to the right place without losing time among dozens of modules.
- What it teaches / measures: Which modules exist and how they are named; it offers multilingual, intuitive matching.
- Where it is used: Exploration by users new to the interface and fast keyboard navigation by experienced users.
There are two quick-access paths to everything in the software; both use the same intuitive, multilingual search source (even if you type in TR, EN results match, and vice versa):
10.1 Top-bar live search
As you type into the search box on the top bar, a dropdown list appears beneath it; matching measurement modules, analyses and workspaces (up to 12 results) are shown. Navigate with Up/Down, and Enter/click selects and opens it directly.
10.2 Command Palette
The command palette opens with Ctrl+K or Ctrl+P (or with the ⌘K button on the top bar):
- With an empty query: all workspaces + recently used modules (up to 8).
- With a filled query: matching intuitive results (up to 30).
- Enter opens the selected (or, if none, the first) row, Esc or clicking outside closes it.
10.3 Application (Family) Filter
The Application: dropdown on the top bar filters all galleries by device family:
| Filter | Scope |
|---|---|
| All | All modules |
| Semiconductor | Transistor/diode/Schottky, etc. |
| Thin film | TFT-focused techniques |
| Photovoltaic | PV J-V, cell metrics |
| Photodetector | Photocurrent/response |
| Dielectric / Insulator | C-V, insulator techniques |
| Piezoelectric / Acoustic | Related techniques |
| General | Family-independent tools |
The selection is persistent (written to the configuration) and is applied simultaneously to the Home, Measure, Analyze, Calc and Control pages.
11. Appearance: Theme, Language, Font and Number Format
All of these settings are found under Settings → Appearance (Theme & font) and Settings → Language and user (Language & user). The theme, language and font are applied with a live preview; changes become permanent only with Save (Cancel reverts to the old value).
11.1 Light Theme — Default
The software ships with the light theme by default (theme: "light"). The dark theme can also be selected; both are derived from the same design-token palette.
| Token | Light theme | Dark theme |
|---|---|---|
| Accent (accent/brand) | #1f6fe0 | #5b9bf0 |
| Background (rail) | #f7f8fa | #0e1116 |
| Panel/card | #ffffff | #161b22 |
| Text (ink) | #161a1f | #e8edf2 |
| EMERGENCY STOP (E-Stop) | #c92a2a | #c92a2a |
11.2 Language (TR / EN)
The interface language is selected between Turkish (tr) and English (en); the default is English (language: "en"). Translation is done with a lightweight dictionary-based infrastructure (app/i18n.py); an unknown key is shown as-is (a missing translation does not break the application).
- The language is applied instantly; however, to avoid TR/EN mixing across the interface, the software recommends a restart on a language change:
ℹ️Note "The application will restart so the language change is applied across the entire interface. Continue?"
- The guide language is a separate setting: you can choose the language of the help/guide texts independently.
11.3 Font
The font family is selected from Settings; if left empty, the embedded default Inter is used (JetBrains Mono monospace for numeric/technical text). The font family is previewed live; a size change is applied on Save.
| Parameter | Unit | Description | Default |
|---|---|---|---|
ui_font_family | text | Interface font family | Empty = Inter |
ui_font_size | pt | Body font size | (system/default) |
11.4 Number Format (Engineering) and Readout Precision
The software can display numbers in three formats, both in input fields and on graph axes. The default is the engineering format (2-Engineering).
| Format code | Label | Example (1.2×10⁻⁵ A) |
|---|---|---|
0-Decimal | 2 decimals — fixed | 0.0000 A |
1-Scientific | 2 decimals — scientific | 1.20e-05 A |
2-Engineering | 2 decimals — engineering | 12 µA |
The calculation of the engineering format (input → formula → output):
input:   value (e.g. 1.2e-5 A)
formula: exponent = floor( log10(|value|) / 3 ) × 3     (range: -12 … +9)
         scaled   = value / 10^exponent
         prefix   = { -12:p, -9:n, -6:µ(u), -3:m, 0:'', 3:k, 6:M, 9:G }[exponent]
output:  "{scaled:.{precision}g} {prefix}{unit}"   ->  "12 µA"
unit: SI prefixes (IEEE/SI engineering notation)- Input fields also accept engineering suffixes: values such as
5 mV,10 nA,1k,2.2µFcan be typed directly; a field can be left completely empty (it does not revert to the old value). - The readout panel decimal places (
readout_decimals, default 2) affect only the readout panel; reports are not affected.
| Parameter | Unit | Description | Default |
|---|---|---|---|
input_number_format | — | Input field number format | 2-Engineering |
graph_number_format | — | Graph axis number format | 2-Engineering |
readout_decimals | count | Readout panel decimal places | 2 |
12. User Modes (Operator / Expert / Developer)
The user mode adjusts how much detail the interface shows according to your role: from a lean operator view to the expert and developer views where all advanced parameters are exposed. Like the "automatic" and "manual" modes of a camera, a beginner works safely with a simplified screen, while an expert has access to every setting.
- Why it is done: To protect the novice user from unnecessary complexity while giving the expert full control.
- What it teaches / measures: A visibility threshold (
min_user_mode) that determines which modules and advanced parameters appear. - Where it is used: Reducing the risk of mistakes in operator training; sharing the same installation among people of different skill levels.
The user mode scales the complexity of the interface according to your role. There are four levels, ordered as follows:
| Mode | Code | Behavior |
|---|---|---|
| Operator | operator | The leanest; only the basic modules; the Advanced parameters section is hidden |
| Simple | simple | A few more modules than Operator |
| Expert | expert | All modules + advanced parameters (default) |
| Developer | developer | The widest; including scripting/developer tools |
- A module card appears only if the user's level is not lower than the module's threshold level (
min_user_mode). - The Advanced parameters section is hidden only in Operator mode; in the other modes it is visible.
13. Keyboard Shortcuts and General Navigation
The software offers a navigation experience consistent with desktop standards (including browser/file-explorer-style forward/back history).
| Shortcut / action | Function |
|---|---|
Ctrl+K or Ctrl+P | Open the command palette |
Alt+Left (StandardKey Back) | Go to the previous location in history |
Alt+Right (StandardKey Forward) | Go forward |
| Mouse side button Back (XButton1) | Back in history |
| Mouse side button Forward (XButton2) | Forward in history |
| Dedicated keyboard Back/Forward keys | Back/forward in history |
Esc | Layered cancel (see below) |
| Up/Down + Enter | Navigate and select in the search/palette list |
The Esc behavior is layered (tried in order):
- If a measurement/series is running, it stops it first (this is the main expectation).
- If you are typing in an input field, it releases focus (cancels the edit; prevents accidentally going back).
- If you are in the inner detail of a page (e.g. the Calc calculation panel), it first returns to the card list.
- If you are in a detail/overlay view, it closes the panel (goes back).
a command) → (3) safely close the connections.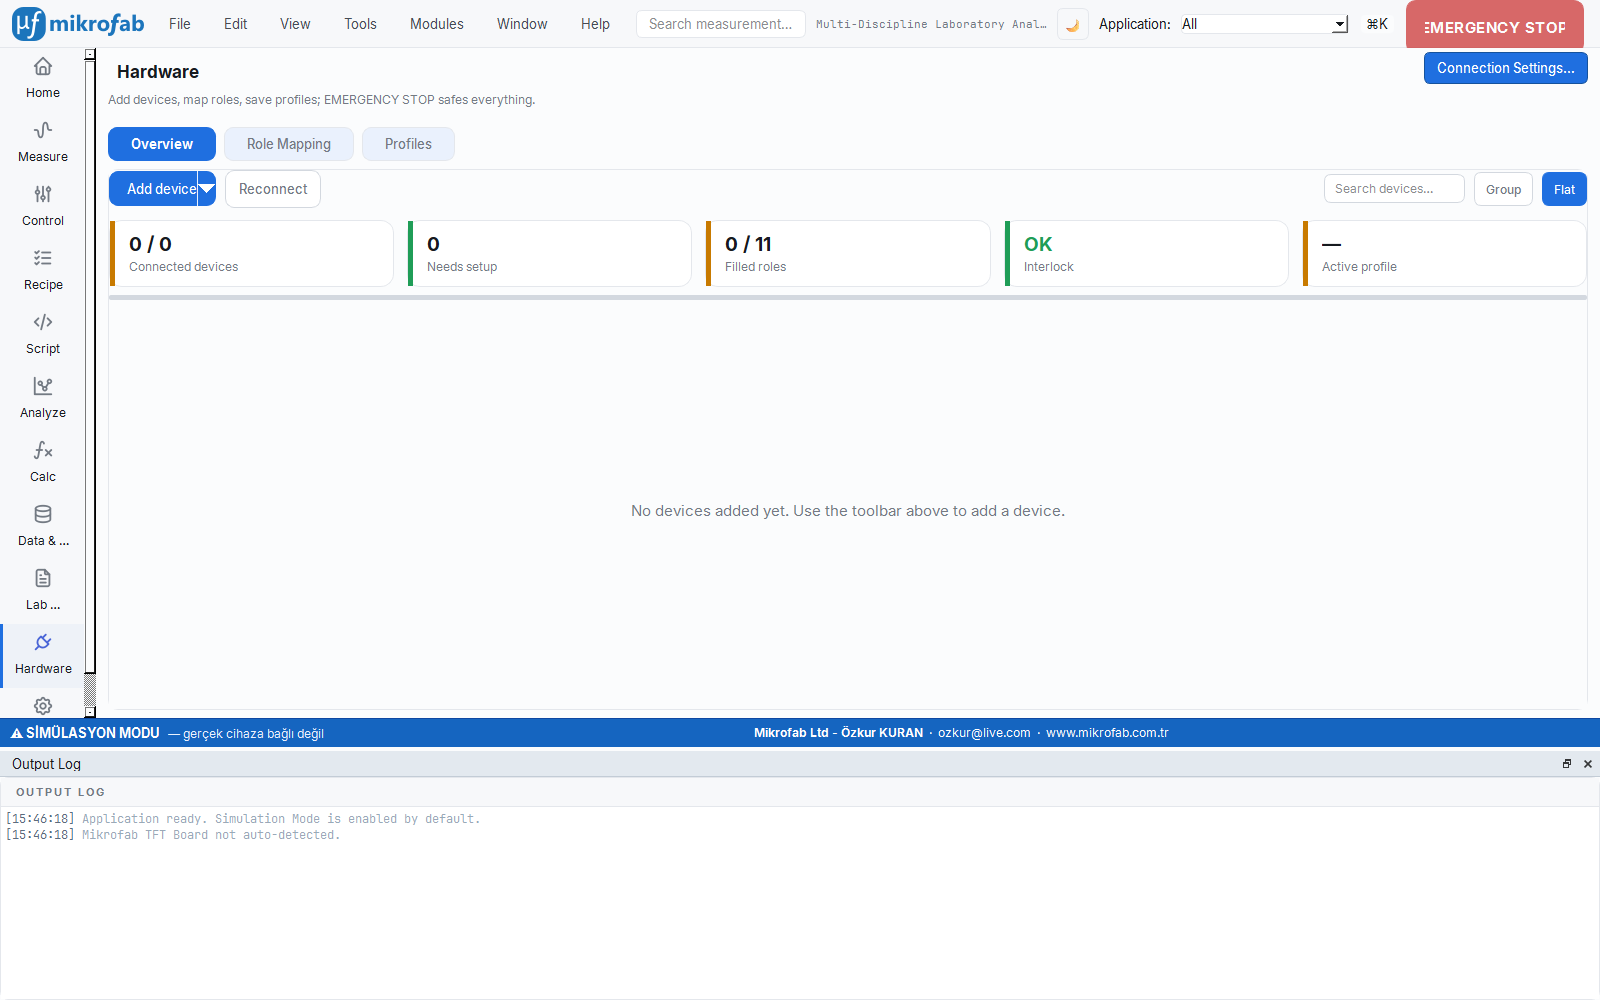
14. Important File Locations (Summary)
| Purpose | Path |
|---|---|
| Measurement data (default) | C:/Users/<user>/Mikrofab |
| User configuration | %APPDATA%\Mikrofab\TFT Measurement App\config\user_config.json |
| Measurement summary database (SQLite) | %APPDATA%\Mikrofab\TFT Measurement App\measurements.db |
| License key | %LOCALAPPDATA%\Mikrofab\TFT Measurement App\license.key |
| Logs | <user data root>\logs\ |
| Default configuration (read-only) | config/default_config.json |
With this chapter you have come to know the software as a whole, the path from installation to the first measurement, and every corner of the interface. The following chapters cover each workspace on the left rail (Measure, Analyze, Calc, Control, Data and Reports, Lab Notebook, Hardware) and the modules within them one by one, together with their formulas and standard foundations.