Reporting and Export
This chapter covers the full set of report and export outputs produced by the Mikrofab measurement and analysis software: how a measurement becomes a traceable, machine-readable and tamper-evident record, which presentation forms (HTML/PDF) are derived from that record, which table formats (CSV/TXT/XLSX/JSON) are written, and how the files are named.
You ran a measurement and saw a nice plot on screen — but will that result still stand as reliable evidence tomorrow, a month from now, or on another computer? Reporting is exactly what guarantees this: it turns the measurement into a permanent official record that carries who/what/when/which instrument information and that reveals any tampering. Export then converts this record into formats (CSV, Excel, PDF, JSON) that others can open and use.
- Why it is done: so the result is traceable, shareable and archivable — "I saw it on screen" is not enough; evidence is required.
- What it teaches / measures: which files a measurement is written to, what each file carries, and which one counts as the "official record".
- Where it is used: lab notebook, quality control, customer delivery, attachments to papers/reports, and long-term archiving.
1. Overview: Three Report Paths
The software produces reports/outputs from three different places. They all share the same discipline (header + sha256 integrity + "missing != zero" + deterministic output), but they serve different purposes.
| Report path | Where produced | Trigger | Canonical output | Presentation |
|---|---|---|---|---|
| Measurement report | Automatically when a measurement finishes | Every save (DataWriter.save) | *_report.json + *_report.csv | (Optional) "Generate report" → HTML + PDF |
| Analysis report | Analysis workspace | "Export" menu | report_json | report_pdf (HTML → Qt PDF) |
| Composed report | Data and Reports workspace | "Generate report" button | *_rapor.json | HTML + PDF (+ CSV) |
Architecturally, the flow is as follows:
                          +- write_json  (canonical, machine-readable, checksum source)
   report dict -----------+- write_csv   (table)             -- DATA format
   (build_report / compose)
                          +- build_report_html (escaped)        -- PRESENTATION (derived from data)
                                                                    PDF: Qt QTextDocument
The report engine lives inside this repository, under app/reporting/; there is no shared external reporting package. The core files:
app/reporting/report_model.py— canonical measurement report model + JSON/CSV writers.app/reporting/report_builder.py— pure HTML generator (build_report_html).app/reporting/analysis_report.py— analysis report (header + payload, same sealing discipline).app/reporting/report_compose.py— the Report Builder engine that merges multiple sources.app/reporting/report_index.py— the index that scans and lists generated reports (database-free).app/storage/data_writer.py— the layer that writes raw + report files during/after a measurement.app/gui/analyze/exporters.py— Analysis workspace export writers.
2. Measurement Report (Automatic, on Every Save)
This is the "default" output you get without pressing any button: every time a measurement finishes, the software automatically opens a folder for that run and writes both the raw data and the official record to disk. Like jotting a note in your lab notebook the instant something happens during an experiment — every run becomes a traceable record without you doing anything extra.
- Why it is done: so no measurement is ever lost; so every run lands by itself in a unique, date-and-time-stamped folder.
- What it teaches / measures: exactly which files (CSV, TXT, XLSX, canonical JSON...) a run is written to on disk.
- Where it is used: every day, on every measurement — this is your fundamental data archive; the other report paths are built on top of it.
When a measurement completes, DataWriter.save(...) is called and all files for that single run are written into the subfolder belonging to that run. This is the software's "default" report generator: without the user pressing any extra button, every measurement lands on disk as a traceable record.
2.1 Run folder and file naming
Every measurement run is written to its own subfolder under the output folder. The folder name is generated by run_folder_name(...):
<output_folder>/YYYY-MM-DD-<Day>-<Type>-<HHMMSS>/
example: measurements/2026-06-12-Wed-PV-103045/
| Part | Description | Example |
|---|---|---|
YYYY-MM-DD | Run date | 2026-06-12 |
<Day> | 3-letter day abbreviation, according to the interface language (not the OS locale) | Wed / Çar |
<Type> | Measurement family abbreviation (from the instrument family) | TFT / Thin / PV / Gen |
<HHMMSS> | Run time (makes each run unique) | 103045 |
HHMMSS makes each run unique, the same folder is never written concurrently on two machines; this prevents OneDrive from producing a PC-named conflict copy (such as ..._IK4ULCE-7). The PC name is not added to the folder name.The base name (base_name) of the files inside the folder is:
<prefix>_<TFT>_<MOD>_<YYYYMMDD_HHMMSS>_<suffix>
If the prefix (filename_prefix) and suffix (filename_suffix) are empty they are skipped; forbidden file characters (<>:"/\|?* and control characters) are cleaned with sanitize_token.
2.2 Files written
DataWriter.save writes the following formats by default (configurable via export_formats; the default is ("csv", "txt", "xlsx") + always the report + metadata):
| File | Format | Separator / encoding | Content |
|---|---|---|---|
<base>.csv | Raw data table | comma, UTF-8 | CSV_COLUMNS (13 columns, raw points) |
<base>.txt | Raw data table | tab, UTF-8 | Same columns, tab-separated |
<base>.xlsx | Excel workbook | openpyxl | "measurement" sheet + "Summary" sheet |
<base>_metadata.json | Free-form metadata | UTF-8, indented | Instrument identity, parameters, summary, counts |
<base>_report.json | Canonical report | UTF-8, sorted keys | Header + columns + rows + sha256 seal |
<base>_report.csv | Canonical table | comma, UTF-8 + BOM | Family columns, dot-decimal |
<base>.h5 | (Optional) HDF5 | h5py | Binary scientific format; seal preserved |
<base>_partial.csv | Crash-safe interim file | comma, UTF-8 | During the run; deleted on successful completion |
The raw-data CSV/TXT/XLSX carry these 13 columns (CSV_COLUMNS):
timestamp, measurement_mode, tft_id, sweep_direction, step_index,
vds_set, vgs_set, vds_measured, vgs_measured, ids, igs, compliance_hit, elapsed_s
*_partial.csv immediately and flushed to disk. If the application crashes or power is lost, the data up to that moment is preserved. When the measurement finishes successfully and the final files are written, the partial file is deleted; otherwise it remains on disk and can later be reloaded with read_points_csv.2.3 Canonical report (*_report.json) — Header / Traceability
The canonical report (*_report.json) is the machine-readable file considered the "single source of truth" for a measurement; every number you see on screen is derived from it. The header is the identity card at the top of this file: like the manufacturing information on a medicine box, it answers which instrument, which version, which sample, and when.
- Why it is done: so the result and its origin (instrument/version/time/sample) are stored together, inseparably.
- What it teaches / measures: where a measurement came from; that unknown fields are left as
nullrather than invented (the honesty rule). - Where it is used: accredited/traceable laboratory records, audits, and answering the question "where did this number come from?".
The canonical report is produced by report_model.build_report(...) and carries a three-level traceability header. The table below shows the top-level fields of the report and their source.
| Field | Description | Source / rule |
|---|---|---|
schema_version | Schema version | Constant "1.0" |
report_id | Unique report identifier | uuid4().hex |
report_revision | Revision number | Increments on revision; reports are not silently edited |
level | Report level | "base" / "customer" / "accredited" (default customer) |
status | Run status | "complete" / "partial" — an interrupted run is not hidden |
created_at | Generation UTC (ms) | ISO-8601, ...Z; comes from the caller (determinism) |
created_at_local | Operator local time | context.started_at (display only) |
app_id / app_version | Software identity/version | Constant "tft-measurement" + __version__ |
recipe | {name, version} | context.mode + software version |
station | {id, serial} | VISA resource + instrument IDN (serial number is not PII) |
calibration | {status, cert_no, valid_until} | Currently a stub (status:"unknown"); PLANNED for accredited |
sample | {id, lot, wafer} | tft_id; lot/wafer are currently null |
operator | Operator | No field in the application → not invented, null |
environment | Outdoor environment header | Open-Meteo instantaneous value; labeled outdoor_* |
simulated | Mock/real flag | "MOCK"/"SIM" in the instrument IDN → true; null if unknown |
null (e.g. operator). The simulated flag stays null if there is no IDN — the report never claims to be a real measurement. This is the foundation of accredited-laboratory traceability.environment block is an outdoor (Open-Meteo) indicator; it is NOT the laboratory indoor condition that actually affects the instrument. For this reason the keys are explicitly labeled outdoor_temp_c, outdoor_humidity_pct, outdoor_cloud_cover_pct, outdoor_condition, with the source open-meteo. If there is no data, all fields are null.2.4 Column families — the right schema per measurement
Every measurement type produces different quantities: for a transistor, gate/drain voltages are meaningful, whereas for a solar cell, power (W) is meaningful. Column families automatically fill the report's table with the columns appropriate to that measurement — like a toolbox where the right tool shows up for each job, so you do not see pointless "Vgs is always 0" columns in a solar-cell report.
- Why it is done: so each measurement family carries only its own meaningful columns, with no misleading/empty columns.
- What it teaches / measures: which measurement mode produces which columns (and derived quantities, e.g. PV power P, resistance R).
- Where it is used: obtaining correct, readable tables when reporting different instrument/measurement types with the same software.
An important design decision: the columns of the report table are chosen by measurement family. In older versions there was a single fixed schema, TFT-shaped (Vds/Vgs/Ids/Igs); a solar-cell report therefore looked like a "transistor report", with Vgs/Igs always coming out as 0. Now each family picks its own columns; because all writers (JSON/CSV/HDF5) use report["columns"], the correct schema is applied automatically.
| Measurement mode | Family | Columns (unit) |
|---|---|---|
| TRANSFER, IV, PULSED_IV, BIAS_STRESS… | tft | vds_set(V), vgs_set(V), vds_measured(V), vgs_measured(V), ids(A), igs(A) |
| DIODE, SCHOTTKY, T_IV, KELVIN, PROBE_IV | two_terminal | v_set(V), v_measured(V), i(A) |
| PV_JV, PV_DARK_JV, PV_HYST, PV_MPPT… | pv | v_set(V), v_measured(V), i(A), p(W) |
| FOUR_POINT, VDP | four_probe | i(A), v_measured(V) |
| ENDURANCE | endurance | cycle, state, v_read(V), v_measured(V), i_read(A), resistance_ohm(Ω) |
Common head/tail columns across all families: point (integer), step_index, sweep_direction, elapsed_s (s), status. The unit and type live in the column definition and are not repeated in each row (single source); the label locale comes from i18n via label_key.
Derived-column formulas:
P = |V_measured · I| (unit: W). Inputs are vds_measured (V) and ids (A); if either is missing the output is null (missing != zero).R = |V_measured / I| (unit: Ω). If the current is 0 or missing, the output is null.2.5 Rows and status — "Missing != zero"
During a measurement, some points may be unmeasurable, or the instrument may hit a limit. The software does not hide these cases: it places a status (ok / na / fail) label on every row and never fills an unmeasured value with 0 — it leaves it empty (null). Like the difference between "left blank" and "0 points" on a questionnaire — confusing the two leads to a wrong interpretation of the result.
- Why it is done: so unmeasured data and genuinely-zero data are not confused, and so analysis is not corrupted by fake zeros.
- What it teaches / measures: whether each point is valid (ok), could not be measured (na), or hit a limit (fail).
- Where it is used: when assessing data quality and understanding how missing points affect the result.
_point_to_row(...) converts each MeasurementPoint into a row. Non-numeric / NaN / Inf values map to null (never to 0). Each row's status field:
| Status | Meaning | Condition |
|---|---|---|
ok | Valid measurement | All other cases |
na | Could not be measured | All of the family's "na attributes" are None (e.g. both ids and igs in TFT) |
fail | Limit/compliance hit | compliance_hit = true (the compliance limit was hit) |
"rows": [
  { "point": 1, "vds_set": 0.0, "ids": 1.2e-6, "igs": 1e-9, "status": "ok"   },
  { "point": 2, "vds_set": 0.1, "ids": null,   "igs": null, "status": "na"   },  // missing != 0
  { "point": 3, "vds_set": 0.2, "ids": 2.0e-3, "igs": 1e-9, "status": "fail" }   // compliance
]
len(points) < parameters.step_count, the report status automatically becomes status="partial"; an interrupted run is never shown as if it had "completed". This is a requirement of metrological honesty.2.6 Integrity (checksum)
Every canonical report carries a "fingerprint" called sha256, computed from its content. If even a single digit in the file is later changed, this fingerprint no longer matches; this is how you tell whether the report has been tampered with. It works like a seal on an envelope that visibly breaks if opened.
- Why it is done: to be able to prove that a report has not been altered since it was produced (a tamper-evident record).
- What it teaches / measures: that the same data always yields the same digest; if the digest does not match, the file has changed.
- Where it is used: archive security, verifying that two files came from the same measurement, and auditing.
Every canonical report carries a sha256 digest, so that if the file is later modified it can be detected (tamper-evident).
input  : report dict (with integrity.value set to "")
formula: sha256( canonical_json(report) )   // sort_keys=True, ensure_ascii=False, compact
output : integrity = { "algo": "sha256", "value": "<64-hex>" }
Before writing the file, write_json calls seal_integrity(...); this is why the JSON on disk carries the sealed value. The checksum is computed without referencing itself (the value is left empty first). Same report → byte-identical output → same checksum.
3. Measurement Report — HTML and PDF Presentation ("Generate Report")
The canonical JSON/CSV is for machines; for humans, a readable, single-file HTML (and PDF) report with the plot and tables embedded is produced. This is like a nicely bound, ready-to-share version of the same data from the canonical record — the numbers are exactly the same, only the presentation is human-oriented.
- Why it is done: to give a colleague, advisor or customer a single printable document with the result.
- What it teaches / measures: how the title, plot, measurement conditions and extracted parameters are presented together.
- Where it is used: sharing, presentations, printing and file attachments — whenever a single portable file is needed.
The canonical JSON/CSV is for machines; the human-facing single-file HTML report (and, where possible, PDF) is produced from the measurement result screen with the "Generate report" button (_generate_report). This presentation is the visible form of the canonical object.
3.1 Report structure (sections)
The generated HTML/PDF consists of the following sections in order (build_report_html):
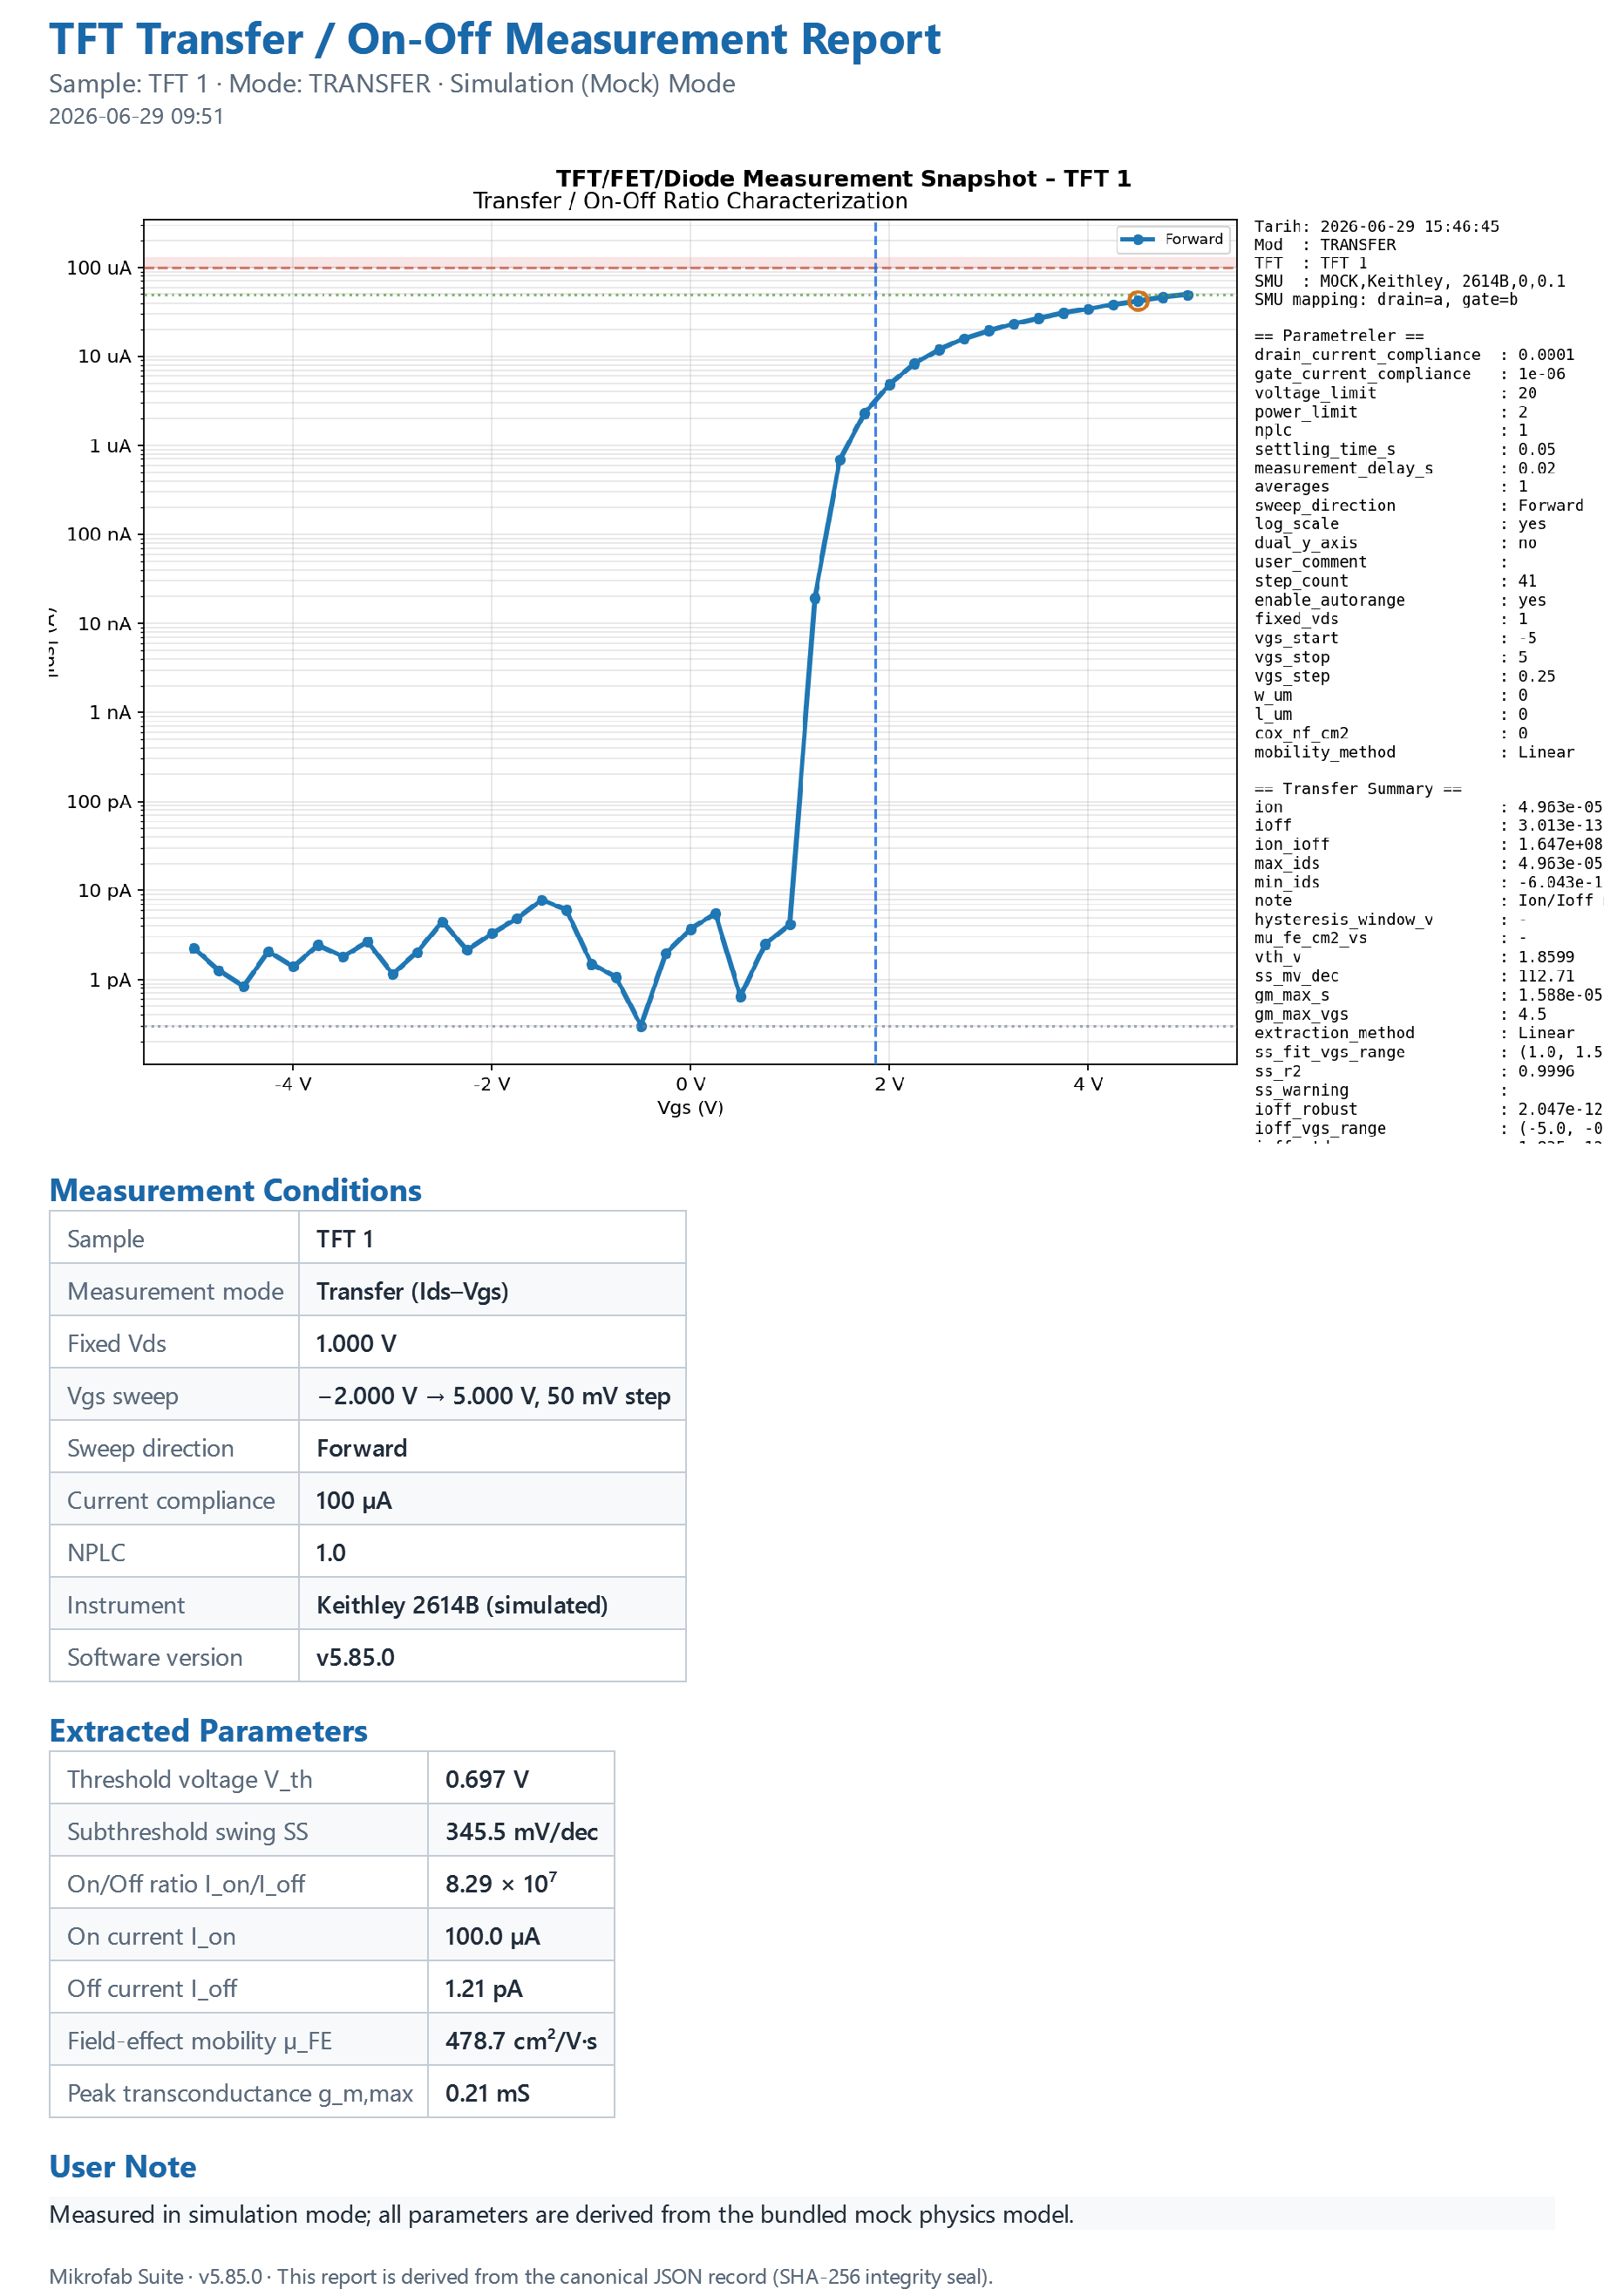
- Title block — Report title (e.g. "TFT Measurement Report"), subtitle (
<TFT> — <Mode>) and generation time (generated_at). - Plot — The current measurement plot is embedded as PNG (markers included). In HTML as a base64
data:URI; in PDF viaQTextDocument.addResourceas aplot.pngresource. - Measurement Conditions table — Mode, TFT ID, instrument IDN, VISA resource, channels (drain/gate), relay state, point count, software version; followed by the sweep parameters and (if present) outdoor environment rows.
- Extracted Parameters table — Mode-aware polished labels (Voc/Isc/FF/PCE, Vth, Ion/Ioff…). If there is no dedicated generator, it falls back to a raw
summarydump. This table uses the single source (summary_format) shared with the Result page; the numbers you see in the report are exactly the same as those on screen. - User Note — A free-text box if
user_commentis present. - Footer — Software version stamp.
3.2 Output files and naming
"Generate report" writes two files (directly into the output folder, not the run subfolder):
<TFT>_<MOD>_<YYYYMMDD_HHMMSS>_report.html
<TFT>_<MOD>_<YYYYMMDD_HHMMSS>_report.pdf
- HTML: Because the plot is base64-embedded, the single file is portable and opens in a browser.
- PDF: Produced via Qt
QTextDocument→QPrinter; there are no extra dependencies. The plot is embedded as aplot.pngresource.
<1e-3) or very large (>=1e5) values use scientific notation (1.2345e-06), others use {:.4g}. All dynamic values are written escaped with html.escape (security).4. Analysis Report (Analysis Workspace — "Export" Menu)
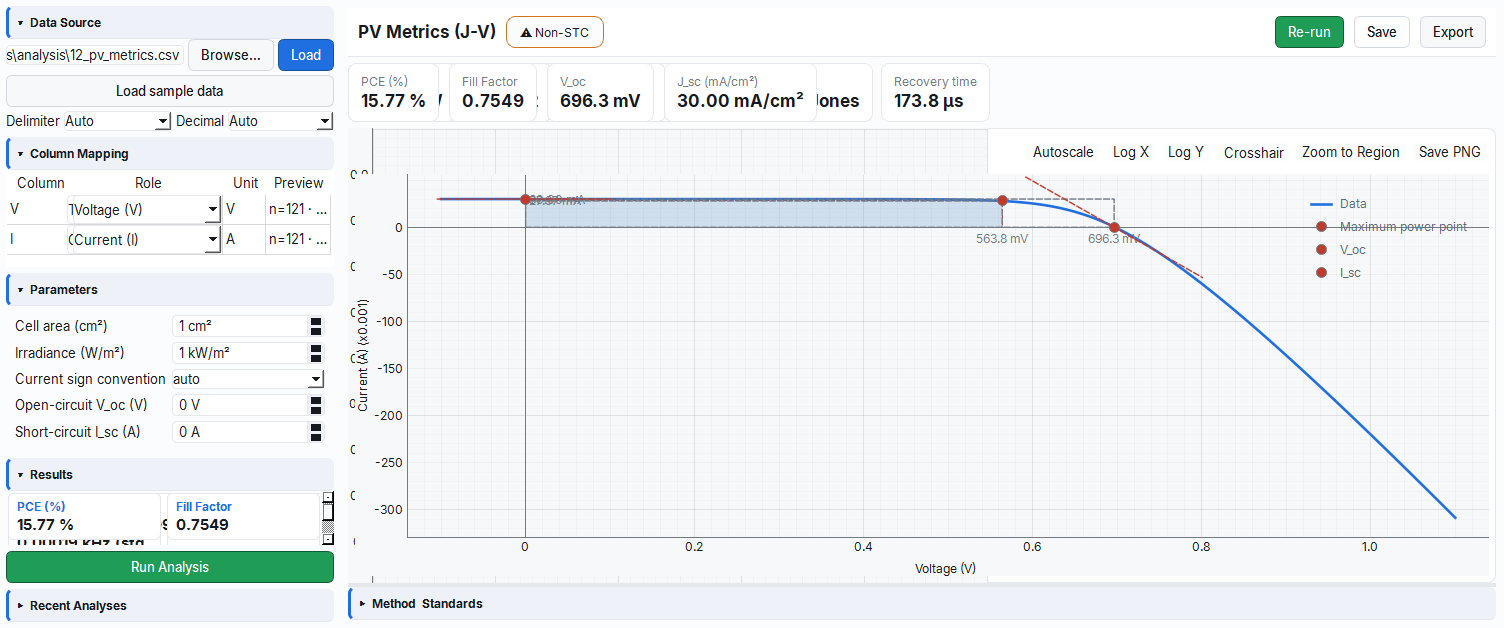
While the measurement report documents the "raw run", the analysis report documents the interpreted result extracted from a file (e.g. Voc/Isc/FF/PCE, threshold voltage). After solving an analysis in the analysis workspace, you export it in the format of your choice from the "Export" menu. If the raw measurement is the "photo that was taken", the analysis report is the "caption written under the photo."
- Why it is done: to record the computed metrics, their uncertainties, and by which method/standard they were extracted.
- What it teaches / measures: the metric values + their uncertainties, the method used, the reliability verdict, and the data provenance.
- Where it is used: when reporting results, when sharing with a reliability stamp (confirmation is required for an unreliable result).
After an analysis is solved in the analysis workspace, the "Export" button (analyze2.header.export) in the top bar opens a menu. The menu contents are the intersection of the formats supported by the active analysis module's descriptor and the formats that are implemented.
4.1 Export menu options
| Menu item (EN) | Token | Writer | Output |
|---|---|---|---|
| CSV (data columns) | csv | write_dataset_csv | Canonical data table (dot-decimal, comma) |
| CSV (Excel-compatible: ; separator, comma decimal) | csv_excel | write_dataset_csv_excel | Local-Excel convenience copy |
| PNG (plot) | png | plot_canvas.export_png | PNG image of the active plot |
| Excel (.xlsx) | xlsx | write_metrics_xlsx | "Metrics" + "Provenance" sheets |
| JSON report | report_json | analysis_report.write_json | Canonical analysis report (header + payload + sha256) |
| PDF report | report_pdf | write_report_pdf | HTML → Qt PDF (plot embedded) |
report_json or report_pdf is selected, if the analysis is marked ✕ Unreliable (e.g. non-STC conditions, low fit), a confirmation is requested before the writer runs (_confirm_report_unreliable). This prevents an unreliable result from being exported as an official report by mistake.4.2 Analysis report (report_json / report_pdf) structure
The analysis report is produced by build_analysis_report(...); it carries the same header discipline as the measurement report and reuses report_model's sealing/checksum/write_json functions (i.e. the JSON is byte-stable and integrity-sealed). The top-level fields:
| Field | Value |
|---|---|
schema_version | "1.0" |
report_id | uuid4().hex |
report_type | "analysis" |
created_at | UTC ISO-8601 (ms) |
app_id / app_version | "tft-measurement" + version |
simulated | null (analysis is file-based; no instrument claim) |
analysis | Payload (below) |
integrity | {algo: "sha256", value: ...} |
The analysis payload (Qt-free, language-independent; labels are kept as i18n keys):
descriptor— Analysis module identifier, version, category, title/summary keys, engine.metrics[]— For each metric, raw GUM fields + formatted display:{key, label_key, unit, value, u_std, k, n, r2, display, primary}. If there is no value,value=null,display="—".method—{description_key, equations[], conventions[], fit_method}. Equations are carried as plain text (plain) + a note; conventions are i18n keys.standards[]— Cited standards:{id, designation, title, edition, scope}(resolved from the registry).reliability— Quality verdict: ✓ Reliable (reliable) / ✕ Unreliable (unreliable) / ⚠ Non-STC (non_stc).provenance— Origin/trace envelope:{data_file, file_hash, column_mapping, parameters, software_version, timestamp_utc}.narrative,notes[],conditions[]— Narrative, notes, and the condition tokens required by the descriptor.
4.3 Uncertainty notation (Quantity / GUM)
No measurement is perfectly exact; every result has a "± how much" margin. This module displays metrics as value ± uncertainty in accordance with the international GUM guide. Like a scale reading "100 g ± 2 g" — a number is meaningful not on its own but together with its confidence interval.
- Why it is done: to express numerically how much a result can be trusted (scientific honesty).
- What it teaches / measures: standard uncertainty (u), coverage factor (k), expanded uncertainty (U = k·u) and sample count n.
- Where it is used: accredited reports, comparative measurements, and "is this difference significant?" decisions.
Analysis metrics are formatted through a Quantity object along the lines of GUM (Guide to the Expression of Uncertainty in Measurement) (format_quantity). The display rules:
value ± uncertainty (coverage note)| Condition | Output |
|---|---|
u_std > 0 and n >= 2 | ± term is shown |
k set (expanded) | U = k · u_std, suffix k={k}, n={n} |
k absent (standard) | suffix std. unc., n={n} |
u_std absent / n<2 | only the value is shown |
- Expanded uncertainty:
U = k · u_std(k = coverage factor). - In data files (JSON/Excel) the raw fields (
value,u_std,k,n) are kept separately; the formatteddisplayis for convenience only.
4.4 Excel export (write_metrics_xlsx)
The analysis Excel output contains two sheets:
- "Metrics" — Columns:
metric, value, unit, u_std, n, display, reliability. One row per descriptor metric; if there is noQuantity, the value is empty anddisplay="—". - "Provenance" — Origin envelope as key/value:
data_file,file_hash,software_version,timestamp_utc, pluscolumn_mappingandparametersas JSON.
write_metrics_xlsx imports the openpyxl package lazily. If the package is missing or the file cannot be written, the writer silently returns False — it does not raise an exception. No Analysis export writer ever crashes; an error is always returned as False.5. Composed Report (Data and Reports Workspace)
You use this path when, instead of a single measurement, you want to gather multiple measurements/analyses and fabrication steps into one professional report. Like collecting scattered pages into a single bound file — you pick a template, check the sections, and build the report you want with a live preview.
- Why it is done: to gather all the evidence for a sample (measurements + steps + plots) into a single, shareable document.
- What it teaches / measures: how multiple sources are selected and arranged by section into a single report.
- Where it is used: sample file, customer delivery, project report — whenever a multi-source summary is needed.
Beyond individual measurement/analysis reports, the Data and Reports workspace offers a Report Builder that combines multiple sources into a single professional report. The engine is report_compose.py: pure, Qt-free; it does not add a new writer on top of the writers above.
5.1 Workspace tabs
| Tab | Key | Function |
|---|---|---|
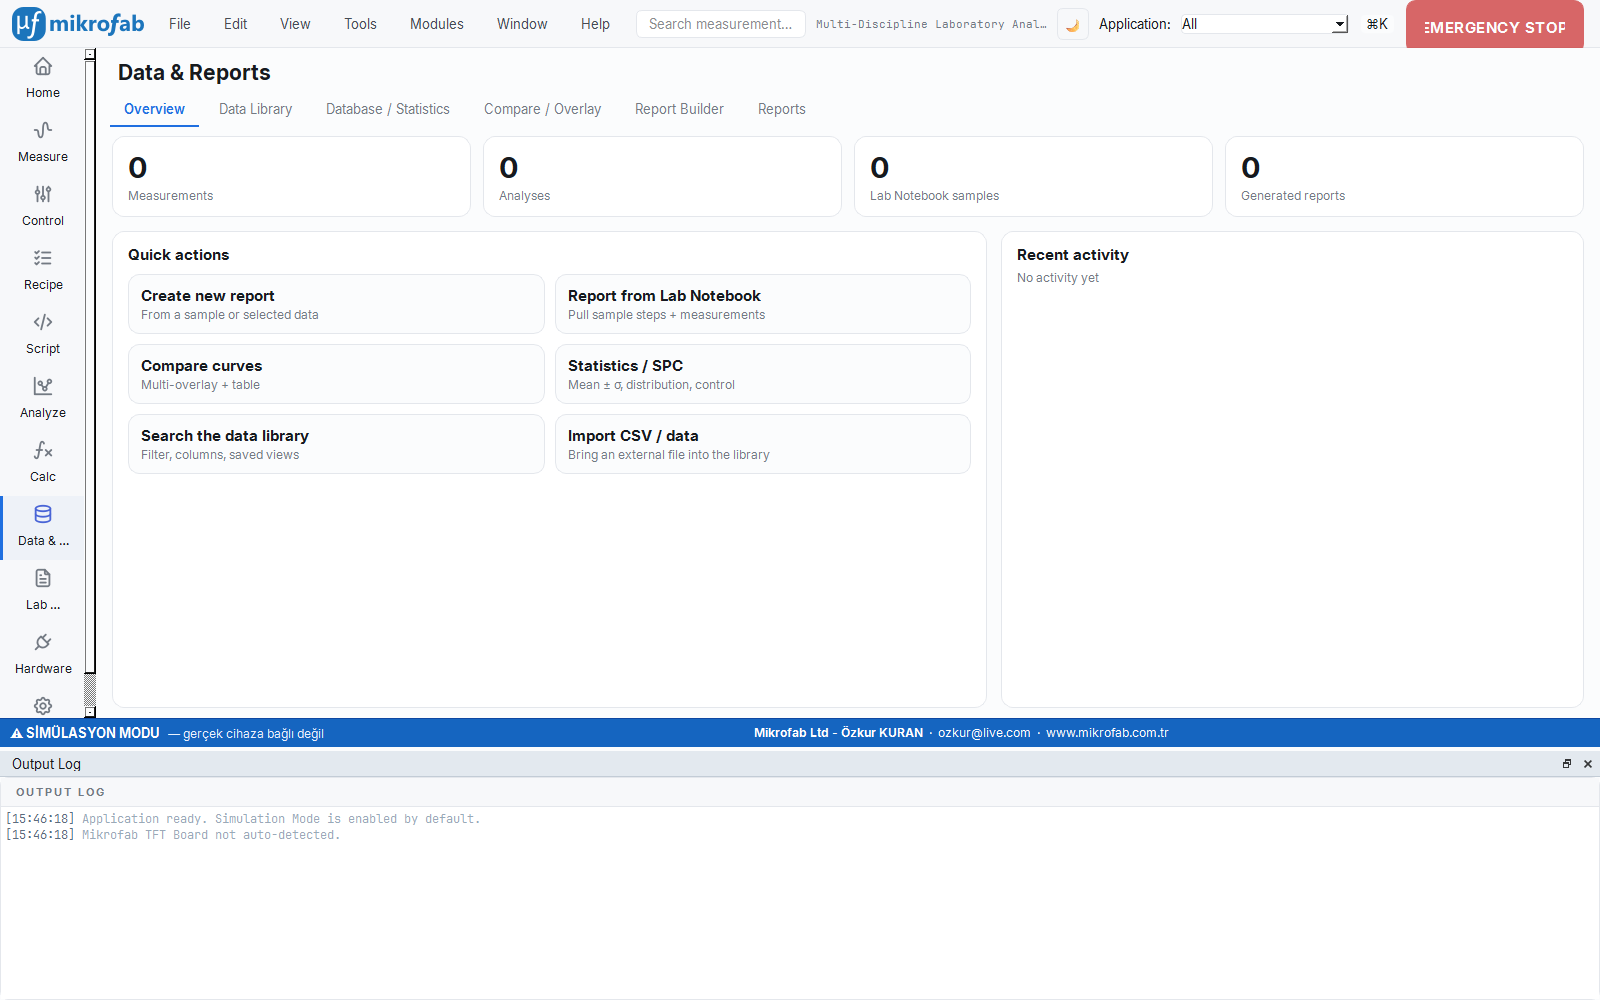
| Overview | overview | KPI cards (measurement/analysis/sample/report counts) + quick actions + recent activity |
| Data Library | library | Embedded database table + detail/inspection panel for the selected record |
| Report Builder | builder | Template + section selector + live preview + "Build" |
| Reports | reports | Library of generated reports (header + staleness + "Open") |
| Compare / Overlay | compare | Overlay multiple curves on top of each other |
| Database / Statistics | stats | Mean±σ / min / max / n across a sample's measurements |
5.2 Report Builder — three-column flow
The Report Builder consists of three columns (there is no drag-and-drop field well; the column families are deterministic):
Column 1 — Setup:
| Setting | Options |
|---|---|
| Source | Selected data (records added from the library/compare) or Lab Notebook (sample bridge) |
| Template | TFT Characterization / Sample File / Comparison / PV Cell Summary / Blank |
| Format | PDF + HTML / PDF / HTML / Full (PDF + HTML + CSV + JSON) |
| Level | Customer (sha256 header) / Base |
Column 2 — Content: Depending on the selected source, either a checkbox list of selected measurements or the Lab Notebook sample selector (fabrication steps + linked measurements). Below it are the section checkboxes.
Column 3 — Live preview: As selections change, the HTML produced by report_compose.compose(...) is previewed instantly (the preview never crashes; on error it shows a red message).
5.3 Report sections
| Section | Key | Default | Locked | Content |
|---|---|---|---|---|
| Header / traceability | kunye | On | Yes | schema_version, app_version, sample.id, created_at, source_sha256, integrity (always first, cannot be turned off) |
| Extracted parameter table | params | On | No | Measurement metric table (Ion/Ioff, Vth, µFE, SS, gm_max, V_on, Rect., Ron, µ_sat, Points) |
| Fabrication steps (Lab Notebook) | steps | On | No | Sample header + fabrication steps + parameters |
| Measurement conditions | conditions | On | No | Mode, VDS, NPLC, Averaging, Sweep, Instrument, VISA (from the first measurement) |
| Plot (curves) | plot | Off | No | Figures passed from the GUI (data-URI) |
| Method notes + R² | method | Off | No | Extraction method, SS fit R², Y-function R² |
| Raw data appendix (CSV/JSON) | raw | Off | No | Path note of the associated raw CSV files |
5.4 Lab Notebook bridge (linking without a schema change)
The Report Builder links measurements to Lab Notebook samples without adding a new table. The link fields: samples.sample_id == measurements.tft_id and sample_steps.linked_measurement_id. The three-hop bridge:
get_sample(sample_db_id)→sample_id.- Wide pool:
measurement_db.query(tft_id=sample_id). - The "called" set: the
linked_measurement_idvalues of the steps (union, unique by id).
5.5 Output files and canonical JSON
"Build" → report_compose.write(...) writes in the selected formats. The file root name: <sample_id or template>_rapor (forbidden characters cleaned).
| Format | File | Writer |
|---|---|---|
| HTML | <name>_rapor.html | Composer |
| JSON | <name>_rapor.json | report_model.write_json (header + sha256 sealed, sorted keys) |
| CSV | <name>_rapor.csv | Metric table (UTF-8 BOM, dot-decimal; header in the companion JSON) |
<name>_rapor.pdf | exporters.write_report_pdf (Qt; lazy import) |
The canonical JSON additionally carries these traceability fields: report_type="composed", source (type, sample_id, measurement_ids, step_ids), source_sha256 and measurements_sha256 (the staleness sub-digest), sections[], and a summarized sample and measurements. Deterministic: a fixed created_at + report_id → byte-identical output.
5.6 Reports library and "staleness" (stale)
A generated report is a sealed snapshot of the data at that moment and does not update on its own. If the source measurements change or are deleted after you produce the report, the software warns you by placing a "stale" badge on that row. Like the expiry date on food in the fridge — it is still there, but you should check its freshness.
- Why it is done: so you can notice that the numbers in an old report may no longer match the current data.
- What it teaches / measures: whether a report is still consistent with its source data, or "stale" (an sha256 comparison).
- Where it is used: when reviewing the report archive; if you see a stale one, re-generate the report for current numbers.
The "Reports" tab scans the output folder without a database: report_index.list_reports(...) reads every *_rapor.json (only report_type=="composed") and lists the header + the generated sibling formats (pdf/html/csv). Double-clicking a row or "Open" opens the report in the default application (priority order: PDF > HTML > JSON).
_is_stale(...) compares the stored measurements_sha256 with one recomputed from the current DB state and, if they do not match, places a "stale" badge on the row. Reports are sealed snapshots — they are never silently auto-updated. If you see a stale report, you must re-generate it for current numbers.5.7 Statistics tab (aggregation)
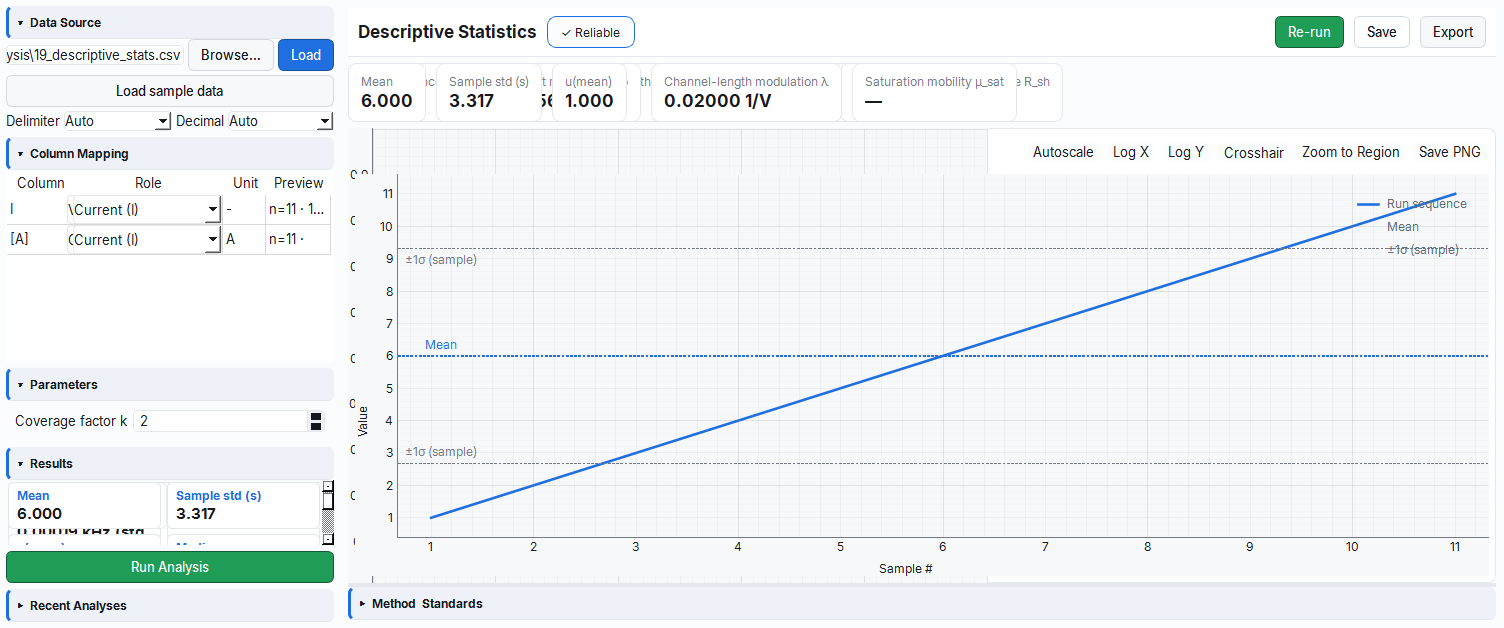
Instead of a single measurement, it brings together all measurements of the same sample and computes summaries such as mean, standard deviation, minimum/maximum and count (n). Like looking at a class average and distribution instead of individual grades — you see repeatability and scatter.
- Why it is done: to understand how repeatable/consistent the measurement is and the typical value range.
- What it teaches / measures: Mean ± σ, min, max and the valid sample count n (missing/NaN values are excluded).
- Where it is used: process stability (SPC) in manufacturing/quality control and sample-to-sample comparison.
The "Database / Statistics" tab aggregates the extracted parameters across all measurements of a selected sample (tft_id) (the benchtop SPC/distribution equivalent):
Mean = Σxᵢ / n
σ (sample std, n-1) = sqrt( Σ(xᵢ − Mean)² / (n − 1) )   // n>1; if n=1 then σ=0
min, max, n
None/NaN values are excluded; if n=0, all statistics are — (missing != 0). The "Report from selection" button opens the Report Builder with that sample.
6. Export Formats (Reference)
The same data can be exported in many formats; the right format depends on what you will do with the file. Roughly: if you will process it by machine, use canonical CSV/JSON; if you will double-click it open in Turkish Excel, use Excel-compatible CSV or XLSX; if you will share/print it, use PDF/HTML; if you will place the plot somewhere, use PNG. Like sending the same document by email, fax or paper — the content is the same, the carrier differs.
- Why it is done: so you can pick the most suitable, least error-prone format for each use (archiving, analysis, sharing, presentation).
- What it teaches / measures: which format is the machine-readable "canonical" record, and which is merely a "convenience copy".
- Where it is used: when transferring data to another tool, archiving it, or sending it to a colleague.
This section gathers all the formats in one place.
6.1 Canonical CSV (machine format)
A locale-independent, single, documented format (report_model.write_csv / exporters.write_dataset_csv):
- Encoding UTF-8 + BOM (
utf-8-sig— so Excel opens it correctly), dot decimal, comma separator, line ending\n. - Headers are stable
key+ unit (e.g.ids_A,vds_set_V), and are never localized. - Missing point → empty cell (
"");0is never written. Thena/fail/okdistinction lives in thestatuscolumn. - The CSV carries only the table; the header + checksum live in the companion JSON file.
point,step_index,sweep_direction,vds_set_V,vgs_set_V,vds_measured_V,vgs_measured_V,ids_A,igs_A,elapsed_s_s,status
1,0,Forward,0.0,0.0,0.0,0.0,1.2e-6,1e-09,0.01,ok
2,0,Forward,0.1,0.0,,,,,0.02,na
6.2 Excel-compatible CSV (convenience copy)
write_dataset_csv_excel — for Turkish/European-locale Excel:
| Parameter | Unit | Description | Default |
|---|---|---|---|
decimal | — | Decimal mark | , (comma) |
delimiter | — | Column separator | ; (semicolon) |
| encoding | — | UTF-8 with BOM | utf-8-sig |
1.5 for a date/thousands separator and corrupts it; this variant opens correctly in that locale. The separator is ; because it must not collide with the , decimal. For a file to be archived/processed, always use the canonical CSV (Section 6.1).6.3 TXT (tab-separated)
<base>.txt — the tab-separated version of the raw measurement table; the same 13 columns, UTF-8. Practical for quickly pasting into tools like Gnuplot/Origin.
6.4 XLSX (Excel workbook)
There are two paths:
- Raw measurement (
DataWriter._write_xlsx): a "measurement" sheet (13 columns) + a mode-aware "Summary" sheet (label/value). Ifopenpyxlis missing, a dependency-free minimal XLSX (direct zip + XML) is written (_write_minimal_xlsx) — i.e. the Excel output is produced in every environment. - Analysis metrics (
write_metrics_xlsx): the "Metrics" + "Provenance" sheets (Section 4.4).
6.5 JSON metadata vs canonical JSON
Two different JSONs must not be confused:
| File | Producer | Purpose | Seal |
|---|---|---|---|
<base>_metadata.json | DataWriter.save | Free-form, human-readable metadata (instrument, parameters, summary, counts) | No |
<base>_report.json | report_model.write_json | Canonical report (header + columns + rows) | Yes (sha256) |
<name>_rapor.json | report_compose.write | Canonical composed report | Yes (sha256) |
metadata.json contains the following fields: device_identity (IDN/VISA/switch_port), relay_enabled, selected_tft, sweep_parameters, date_time, started_at, user_comment, software_version, smu_mapping (drain/gate), point_count, planned_point_count, stopped_early, compliance_hit and (if present) <mode>_summary.
6.6 PNG (plot image)
Plots are exported as PNG:
- Measurement report: The plot is rendered to PNG at 150 DPI and embedded into the HTML as base64 and into the PDF as a
plot.pngresource. - Analysis: Via "Export → PNG", the active plot is written directly to a PNG file (
plot_canvas.export_png).
The generated report files are named so that their source is evident: measurement reports follow <TFT>_<MOD>_<date>_<time>_report.json / _report.csv, while composed reports follow the *_rapor.json pattern. This way each output reveals from its name which measurement or session it was derived from.
6.7 File naming convention — summary
| Output | Template |
|---|---|
| Run folder | YYYY-MM-DD-<Day>-<Type>-<HHMMSS>/ |
| Raw + report files | <prefix>_<TFT>_<MOD>_<YYYYMMDD_HHMMSS>_<suffix>.<ext> |
| Canonical report | <base>_report.json / <base>_report.csv |
| Measurement HTML/PDF report | <TFT>_<MOD>_<YYYYMMDD_HHMMSS>_report.{html,pdf} |
| Composed report | <sample or template>_rapor.{html,json,csv,pdf} |
| Crash-safe interim file | <base>_partial.csv |
7. Determinism, the Locale Trap and Levels
7.1 Determinism (the rule every writer obeys)
- Same input → byte-identical output.
_canonical_jsonusessort_keys=True,ensure_ascii=Falseand compact separators; there is no hidden wall-clock in the payload —created_atcomes from the caller. A caller wanting bit-identical output passes a fixedcreated_at+ fixedreport_id. - Locale-independent data. JSON/CSV numbers are of numeric type and use dot-decimal. Only the human HTML/PDF presentation is localized.
- Escaped HTML.
build_report_htmlpasses every dynamic value throughhtml.escape.
_csv_value forces dot-decimal with repr/{:.0f}; _utc_iso_ms writes ISO-8601 UTC. The local view is only for the application interface.7.2 Level → required-field mapping
| Field | base | customer | accredited |
|---|---|---|---|
| Header (id, app/recipe version, station, sample, created_at, status, simulated) | Yes | Yes | Yes |
columns.unit + type | Yes | Yes | Yes |
integrity (sha256 checksum) | — | Yes | Yes |
report_revision + stable archival language | — | Yes | Yes |
columns.spec {min,max} | PLANNED | ||
columns.uncertainty {..., k} | — | — | PLANNED |
calibration.cert_no / valid_until | — | — | PLANNED |
signoff (prepared by/approved by/signature) | — | — | Field exists, empty; filling is PLANNED |
Native PDF/A + embedded fonts / write_xlsx | — | — | PLANNED; PDF today via Qt |
7.3 What is currently PLANNED
The following are defined in the contract but not yet implemented; the report does not claim them:
- A native
.xlsxreport writer and an archival PDF/A profile (currently PDF is produced from HTML via Qt). - A GUM Type-B uncertainty column for measurement metrics (the measurement DB carries bare scalars; uncertainty lives on the analysis-kit
Quantitypath). - A Level-2 uncertainty budget, a calibration certificate and a signature chain (e.g. PAdES for PDF);
calibrationandsignoffare currently stubs. - Background-thread generation for large/bulk reports.
8. Standard References
The behaviors in this chapter are based on the in-repo contracts and standards:
docs/standards/06-reporting.md— The reporting standard (determinism, checksum, three-level header, locale trap, "missing != zero", auto-transmission ban).docs/guides/reporting-guide.md— The concrete contract: canonical JSON skeleton, column definitions, CSV convention, writer contract, composed report (report_compose).docs/standards/03-measurement-and-analysis.md— Result + R² + uncertainty.docs/standards/05-data-and-database.md— Stored data /NULLdiscipline.docs/standards/12-i18n-l10n.md— The locale/language distinction.- Analysis standards (citation): analysis reports carry the relevant measurement standard (
designation/title/edition/scope) via thestandards[]in the module descriptor.
9. Quick Reference and FAQ
Which file is the official record of a measurement?
<base>_report.json (canonical, sha256-sealed). The human-facing presentation is derived from it.
My Excel shows comma-formatted numbers as broken — what should I do?
Use the "CSV (Excel-compatible)" variant (Section 6.2) or prefer XLSX. For archiving, always keep the canonical CSV (dot-decimal).
Why does a value appear empty/— in the report?
That point could not be measured (status="na") or the metric could not be computed. The software never fills a missing value with 0 (missing != zero).
What does the "stale" badge mean?
The source measurements changed/were deleted after the report was produced. Re-generate the report for current numbers; the existing report remains as a sealed snapshot.
How do I verify that two files came from the same measurement?
Via integrity.value (sha256). The same report dict always yields the same digest; if the file changed, the digest does not match.
Why is the PDF sometimes not produced?
The PDF is produced via Qt (QTextDocument → QPrinter); if Qt is missing or there is a write error, the writer silently skips it and at least the HTML/JSON is preserved (robust-generation principle).