Logs, Diagnostics, Telemetry and Safety
This chapter covers the four interrelated systems that form the operational backbone of the Mikrofab semiconductor/TFT/PV measurement and analysis software: the logging infrastructure, the diagnostics tools, the usage report (telemetry) and hardware safety. All of these systems are designed to reliably answer the question "what happened when something went wrong?", to protect privacy, and to bring the instrument to a safe state under all circumstances.
The shared design principle is this: secrets are never written to disk or sent over the network; personal data (PII) is masked; the hardware is brought to a safe state on every error, abort and shutdown. The subsections below describe each system individually, staying faithful to the actual behavior in the code.
This chapter describes the four systems that work silently in the background while you measure but save the day when something goes wrong: the logs that record what happened, the diagnostics that find what broke, the anonymous usage report (telemetry) that helps improve the software, and the safety layer that brings the instrument to a safe state in every situation. Think of it like an aircraft's black box, maintenance checklist and emergency landing procedure: most of the time you won't notice it, but when something goes wrong, this is the first place you turn to.
- Why it is done: To reliably answer "something went wrong — what happened and why?", to protect privacy, and to be able to stop without damaging the instrument.
- What it teaches / measures: The trail of events (what, when, at what severity), the health of the instrument, anonymous usage trends, and the hardware's safe limits.
- Where it is used: Troubleshooting, support requests, privacy compliance (KVKK/GDPR) and laboratory safety.
1. Logging System
The software has two entirely separate log streams, and it is critically important not to confuse them:
- Local diagnostic log — written to disk, stays on the machine, never sent anywhere over the network. Used for troubleshooting and support.
- Output Log console — a color-coded, live, operator-facing stream in the interface. Shows what is happening during a measurement in human-readable form.
These two serve different purposes; both are entirely independent of the telemetry/usage report (Section 3).
1.1. Local log file and rotating retention (rotation)
The local log is an "event journal" that writes every significant action the software performs to a text file kept on the machine, with a date and time. Rotating retention keeps this journal from growing forever and filling the disk: when the file reaches a certain size, a new one is started and the oldest backup is deleted. Just like a notebook with a limited number of pages that tears out and discards the oldest page once it is full.
- Why it is done: So you can look back and see "what exactly happened at that moment?" when a problem occurs, without overflowing the disk while doing so.
- What it teaches / measures: A timestamp, severity level and message on each line; total disk usage stays within a fixed upper bound (≈12 MB).
- Where it is used: Troubleshooting and support — when reporting a bug, this file is usually the first thing requested.
The local log is produced by a single logger named tft_measurement_app and is written both to a file and to the standard console (stderr). To prevent unbounded growth, the file is kept on a rotating basis.
| Parameter | Unit | Description | Default |
|---|---|---|---|
| Logger name | — | Named logger used across the application | tft_measurement_app |
| File name | — | Active log file | tft_measurement_app.log |
maxBytes | bytes | When the file reaches this size, a new file is started | 2.000.000 (≈2 MB) |
backupCount | count | Number of retained backup (old) files | 5 |
| Total maximum | MB | Active + 5 backup files | ≈12 MB |
| Encoding | — | File character encoding | utf-8 |
log_level | — | Lowest level written | INFO |
log_directory | — | Log folder name (under the root) | logs |
Rotation logic: when the active file reaches 2 MB, ...log is renamed to ...log.1 and the oldest backup (...log.5) is deleted. This way total disk usage always stays within the upper bound.
The log line format is fixed and machine-parseable:
2026-06-29T14:32:07 | INFO | tft_measurement_app | Keithley 2612A baglandi
<timestamp (UTC)> | <LEVEL> | <logger name> | <message>time.gmtime). The reason is that local log timestamps can then be compared directly with the telemetry/report created_at fields (which are also UTC). The Output Log in the interface, on the other hand, shows local time (see 1.4) — keep this difference in mind when comparing the two.1.2. Location of the log file
The log file is kept in the logs folder under the user-specific data root. The data root is determined by selecting the first writable option in the following order:
- The
MIKROFAB_APPDATAenvironment variable (if set) — for portable/custom installations. %APPDATA%\<Vendor>\<Application>\(the typical path on Windows).%LOCALAPPDATA%\<Vendor>\<Application>\(fallback).~/.mikrofab/tft_measurement_app/(home directory fallback).<working directory>/user_data/(last resort).
So the typical full path on Windows is:
%APPDATA%\Mikrofab\TFT Measurement App\logs\tft_measurement_app.log%APPDATA% into the address bar of a File Explorer window and navigate to the relevant vendor folder. A more practical approach is to use the Export Diagnostic Package feature directly (Section 2.1); this feature gathers all logs into a single zip.1.3. PII masking and secret protection (in the local log)
This feature runs each line through a filter just before it is written to the log: if it contains a "secret" such as a password, token or API key, the entire line is hidden; if not, only the user name in the file path is masked. This way, no sensitive information leaks when the log file is shared with someone. Like blacking out the confidential parts of a document with a marker before handing it over to be photocopied.
- Why it is done: Logs are shared for support/diagnosis; to prevent secrets and personal data (PII) from accidentally leaking out.
- What it teaches / measures: Which keywords count as a "secret", and that a suspicious line is hidden entirely while the user name is hidden partially.
- Where it is used: Privacy compliance and safe support sharing — especially when sending the Diagnostic Package outside.
Every line written to the local log passes through a PII filter (PiiFilter) before it lands in the file/console. This filter applies two rules:
Rule A — A line that may contain a secret is fully redacted
The message text is converted to lowercase and searched for any of the keys below; if one is found, the entire line is replaced with <redacted: possible secret> (the content is never written):
| Key group | Searched terms |
|---|---|
| API key | api_key, x-api-key, apikey |
| License | license_key, license-key |
| Password | password, passwd |
| Token/authorization | token, secret, authorization, bearer |
| Private key | private_key, private-key |
Rule B — The user name in the file path is masked
If the line does not contain a secret, the user-name component within the path is replaced with <user>:
| Input example | Output |
|---|---|
C:\Users\ahmet\data\out.csv | <user>\data\out.csv |
/home/ahmet/measurements | <user>/measurements |
In addition, uncaught exceptions are logged at the CRITICAL level together with their full traceback. Because this mechanism is active both while the GUI is running and in headless execution, the cause of a crash is always recorded to the file.
1.4. Output Log console panel (Output Log)
The Output Log is a color-coded, human-readable, live message stream that scrolls at the bottom of the screen while a measurement is running. The local log file is for "reviewing later", whereas this panel is for answering the question "what is happening right now?". Like the live speed/heart-rate display on a treadmill's screen — it lays out what is going on right before your eyes.
- Why it is done: So the operator can instantly see the state (connection, step, error) during a measurement.
- What it teaches / measures: The type of message by color code — amber for warning/error, cyan for connection, blue for measurement, gray for neutral information.
- Where it is used: Live measurement monitoring; especially to stop and investigate the cause when you see an amber line.
The Output Log located at the bottom of the interface (title: "OUTPUT LOG") is an operator-facing, read-only, color-coded live stream. It is placed inside a side/bottom panel (dock) with the title "Output Log" and is tabbed in the same area as the Reading Values panel.

Panel features:
- Location: A detachable/floatable dock anchored to the bottom edge of the window.
- Visibility: Can be toggled via the
View > Log / Consolemenu. - Content: Each line is a local timestamp in
[HH:MM:ss]format + the message. - Simultaneous local log: Every message written to the console is also written to the local log file at the same time via
logger.info(...)(single call, dual target).
Color coding. The console automatically classifies a line into one of four colors based on the message content (it looks at keywords in the content):
| Category | Color | Triggering keywords (content) |
|---|---|---|
| Warning / Error | Amber (#f0a23c) | hata, error, uyari, compliance, abort, durdu, timeout |
| Connection | Cyan (#56c2e6) | bagland, bagli, connected, port, visa, keithley, switch, smu |
| Measurement | Blue (#54b4ee) | olcum, adim, nokta, step, ids, kaydedildi, sweep |
| Information (neutral) | Gray (#9aa9b8) | (if none of the above match) |
2. Diagnostics
The diagnostics tools let you diagnose a problem without remote support, or by preparing a clean package that can be sent to the developer. There are three layers: diagnostic package export, hardware self-test, and step-by-step troubleshooting (troubleshoot) with one-click fixes.
2.1. Exporting a diagnostic package
The diagnostic package is a "one-button support file" generator that gathers the logs and system information needed to solve a problem into a single zip file. You don't have to hunt for files one by one, and secrets are automatically redacted. Like collecting all your test results into a single file to take to the doctor.
- Why it is done: To send a clean, complete and secret-free diagnostic package to the support team or developer.
- What it teaches / measures: Version, operating system, Python and sim/real status (
system_info.json) plus all logs. - Where it is used: Bug reporting and remote support — the fastest and safest way to share a problem.
The diagnostic package gathers everything needed for support/debugging into a single zip file. The operation is designed to be independent of the GUI (pure), best-effort, and to never crash the application.
What is included in the package:
| File | Content |
|---|---|
logs/* | All log files in the logs folder (up to the size limit) |
system_info.json | Version + operating system + Python + sim/real status |
settings.json | Application settings — with secrets redacted |
manifest.json | List of included logs + total bytes |
Contents of system_info.json:
| Field | Description |
|---|---|
exported_at | Export time (UTC, ISO 8601, with trailing Z) |
app_id | tft-measurement |
app_version | Application version |
simulated | Whether it was running in mock/simulation mode (true/false) |
python_version | Python version |
platform, machine, os, os_release | Operating system and architecture information |
Secret redaction (in settings). Before settings.json is written, every setting field whose name contains one of the hints below is replaced with <redacted> (nested dictionaries are scanned recursively):
api_key · api-key · apikey · token · secret · password · passwd
license_key · license-key · private · signing · authorization · bearer| Parameter | Unit | Description | Default |
|---|---|---|---|
max_log_bytes | bytes | Total upper limit of logs included in the package | 20.000.000 (≈20 MB) |
If this limit is exceeded, the largest log files are skipped (the package is still produced); this way the zip file stays a reasonable size.
2.2. Hardware self-test (Self-test)
The self-test is a quick health check that answers the question "is the instrument alive and able to talk?" using read-only operations (without applying any current/voltage at all). It checks the connection, identity and error queue in order. Like a doctor taking your pulse and saying "breathe in, breathe out" — it checks the basic functions without putting you at risk.
- Why it is done: To make sure communication with the instrument is sound before starting a measurement.
- What it teaches / measures: An overall PASS/WARN/FAIL result and which check got stuck; because it is read-only, it is safe even with a DUT connected.
- Where it is used: Setup verification and fault analysis — to tell apart "is the instrument broken, or the cable?".
The self-test verifies that an instrument is "alive and reachable" using read-only checks. No output or current is applied — so it can be run safely even when a DUT (device under test) is connected.
The self-test is triggered from the action menu of the device card on the Hardware page. The test runs in the background (on a non-blocking thread); the panel is modeless (it does not block your other work) and is updated via a signal when the test finishes.
Checks run (in order):
| # | Check | What it does | Failure result |
|---|---|---|---|
| 1 | Connection | Verifies that the driver session is open (no writes/current) | FAIL |
| 2 | Identity | Queries *IDN?; expects a non-empty identity response | FAIL |
| 3 | Error queue | Reads the device error queue with SYST:ERR?; expects it to be empty | WARN (if not empty) |
| 4 | Basic read | Performs a second *IDN? round-trip to verify the stability of communication | FAIL |
| 5 | *TST? self-test (optional) | If supported, runs the IEEE-488.2 internal self-test (QCoDeS driver only) | FAIL |
The overall result (roll-up) calculation is determined by the worst individual check:
input  : status of each check {OK, WARN, FAIL, SKIP}
formula: any FAIL  -> overall = FAIL
         (no FAIL) any WARN -> overall = WARN
         (only OK)            -> overall = PASS
output : PASS / WARN / FAIL  (SKIP is ignored in the roll-up)
basis  : IEEE-488.2 self-test (*TST?) + device error queue (SYST:ERR?) contract
Panel view and status band:
| Overall status | Label | Color |
|---|---|---|
| PASS | "Self-test passed" | Green |
| WARN | "Self-test passed with warnings" | Amber |
| FAIL | "Self-test failed" | Red |
Panel elements:
- Status band: A large, color-coded PASS/WARN/FAIL label.
- Busy bar: An indeterminate (marquee) animation while the test runs; it keeps the panel from looking frozen during a slow real check (the
*TST?,SYST:ERR?loop). It is hidden once the result arrives. - Intro line: "This self-test runs the following read-only checks on the device:" — explains what will be done before the test.
- Check lines: An icon + name + message for each check. Icons:
✓(OK),⚠(WARN),✗(FAIL),–(SKIP / not done). - Raw error section: The raw text returned from the device error queue (monospace); hidden if the queue is empty.
2.3. The diagnostic band, troubleshooting and one-click fixes
When a device cannot connect, this feature explains the likely cause in plain language instead of a dry error code, and offers one-click solutions such as "Reconnect" and "Troubleshoot". The Troubleshoot window, in turn, lets you check the most common causes (power → cable → driver → port → another program) in order. Like a repair technician's checklist that says "try this first, then that".
- Why it is done: To solve connection problems in a logical order without needing an expert.
- What it teaches / measures: The likely root cause of the problem and the concrete steps to fix it.
- Where it is used: Everyday fault analysis — when a device does not appear or no
*IDN?response is received.
When a device cannot connect or does not respond, the Hardware page shows a diagnostic band. The band explains the likely cause of the problem in human-readable form and offers one-click fix actions. Example causes and actions:
| Condition (cause) | Description | One-click actions |
|---|---|---|
No *IDN? response | "There is no *IDN? response at this address. The device was enumerated but the session timed out — usually power, the USB cable, or another program holding the device." | Reconnect · Send *IDN? · Troubleshoot |
| Serial setup required | "Serial devices are not auto-discovered. Verify the ASRLxx port, set the baud/parity settings, and identify it with *IDN?." | Configure serial port · Auto-detect baud |
Step-by-step Troubleshoot window (Troubleshoot). The "Troubleshoot" action opens a device-specific modeless checklist. The window lists five steps, each with a Retry button next to it; "Retry" re-runs the relevant *IDN? probe off the GUI thread:
| Step | Icon | Check |
|---|---|---|
| 1 | ⚡ | Check the power connection |
| 2 | 🔌 | Check the cable |
| 3 | 💾 | Check the driver |
| 4 | ⚠ | Check for a port conflict |
| 5 | 🔒 | Another program may be holding the device |
At the bottom of the window, the raw error text of the last error (monospace) is shown, along with a Help link (https://mikrofab.com/docs/troubleshoot) that goes to the online troubleshooting guide.
3. Telemetry / Usage Report
The usage report (telemetry) collects anonymous, PII-free event signals to understand how the software behaves under which conditions and to proactively fix bugs. The system works offline-first and is tightly constrained by a consent model.
3.1. Offline-first queue
The telemetry queue is a "waiting list" that first writes the anonymous event signals to be sent to a local file and then sends them in a batch in the background when the internet is available. If there is no internet, the data is not lost but queued; meanwhile the measurement software never waits. Like the messages you write in a no-signal area being sent automatically once your phone reconnects to the network.
- Why it is done: So that telemetry never slows down or crashes the measurement, and so no data is lost while offline.
- What it teaches / measures: How the queue is bounded (size/event upper limit) and that failed sends are retried.
- Where it is used: Reliable, background usage reporting even in field/offline laboratories.
Telemetry calls never stall or crash the application. Events that cannot be sent (when there is no internet/endpoint) are written to a queue file and sent in a batch on the next attempt.
| Parameter | Unit | Description | Default |
|---|---|---|---|
| Queue file | — | Pending events (each line is one JSON event) | telemetry_queue.jsonl |
flush_interval | seconds | The background worker's send-attempt interval | 15 |
_BATCH | count | Maximum events sent in a single POST (the server rejects >1000 with 413) | 500 |
max_queue_events | count | Maximum events held in the queue (when exceeded, the oldest are dropped) | 5000 |
max_queue_bytes | bytes | Maximum size of the queue file | 5.242.880 (5 MB) |
timeout | seconds | Network timeout for a single POST | 8 |
endpoint | — | Event endpoint | https://telemetry.mikrofab.com/api/events |
Workflow:
- When an event is produced, it is appended to the
telemetry_queue.jsonlfile (append). - A background worker (daemon thread) periodically sends the queue by taking a snapshot (a
.sendingfile); new events are not blocked during this. - If the send succeeds, the events are removed from the queue; if it fails, they stay in the queue (no data loss).
- A
.sendingfile left over from a previous run is recovered back into the queue at startup (crash resilience). - On exit (
shutdown), one final attempt is made to flush the queue.
X-API-Key is sent in the POST header; the body is JSON in the form {"events": [...]}. Responses other than HTTP 2xx are treated as failures and the events are retained to be retried.3.2. What is sent, what is not
This section makes telemetry's privacy promise concrete: only flags, numbers and broad "buckets" leave the machine; raw measurement data, personal information and secrets never leave. Identifying fields such as address/IP are reduced to only the "bus type". Like marking only your age range instead of your exact birth date on a survey — the information stays useful but does not identify you individually.
- Why it is done: To collect enough information to improve the software while keeping the user and their data unidentifiable.
- What it teaches / measures: Which fields are sent anonymously, which are never sent, and the masking/bucketing logic.
- Where it is used: Privacy assessment and compliance — a clear answer to "where does my data go?".
The core principle of telemetry: raw scientific data, personal data and secrets are never sent. Everything sent is either a flag, a number, or a low-cardinality class/bucket. Fields such as address/IP are reduced to only the bus type.
| Sent (anonymous) | Never sent |
|---|---|
| Event names (app_started, measurement_finished, software_error …) | Raw measurement series / V-I curves / measured quantities |
| Mode, point-count bucket, duration bucket | Sample name, operator name, email, free-form notes |
| Device model/brand/family, bus type (GPIB/TCPIP/USB…) | Raw VISA address / IP / hostname |
| Compliance hit count, first-hit step (aggregate) | Instrument serial number |
| OS class (Windows 11/10/macOS/Linux), CPU/RAM bucket | Full OS build, locale, timezone, full screen resolution |
| Setting key (setting.changed) | Setting value |
| Recipe source (builtin/custom) + measurement type | Recipe/template name (customer IP) |
| License funnel stage + result code | License token/key/subscription detail |
Firmware version (only if device_firmware consent is on) | — |
Masked full traceback (only if error_trace consent is on) | Unmasked path/user name |
Masking helpers. Two layers are applied before sending:
mask_pii: Masks in-path user names in the text (C:\Users\X,/home/X→<user>) and the bare session-user name where it appears.sanitize_params: Strips PII keys (name, operator, email, note, title, etc.) from the parameter dictionary by word-fragment matching. An important subtlety: the match is on the exact word fragment; this is why non-PII settings such assample_rateoraddressare not stripped by mistake, butsample_name/operator_name/numune_adiare stripped.
Fingerprint reduction — bucketing. Raw hardware/screen values are reduced into buckets so as not to make the machine unique:
| Quantity | Buckets |
|---|---|
| CPU cores | 1-2, 3-4, 5-8, 9-16, 17-32, 32+ |
| RAM (GB) | <4, 4-8, 8-16, 16-32, 32-64, 64+ |
| Point count | <=10, 11-100, 101-1000, 1001-10000, 10001-100000, 100000+ |
| Duration (s) | <1m, 1-5m, 5-30m, 30m-2h, >2h |
| Screen resolution | <=720p, 1080p, 1440p, 4K, 4K+ |
3.3. Consent model and geo-gate
The consent model gives the user the final say over which telemetry categories are on; the geo-gate, in turn, sets a safe starting default based on your region. In consent-mandatory regions like Turkey, everything starts off and no data leaves until the user explicitly approves it. Like the cookie-consent dialog on a website — but it starts the decision on the off side, in respect of your region's law.
- Why it is done: To comply with legal requirements such as KVKK/GDPR and to give the user control of their privacy preference.
- What it teaches / measures: The six categories, the "notice/consent" distinction, and the initial defaults by region.
- Where it is used: Initial setup (onboarding) and changing it at any time later from Settings > Privacy.
Which telemetry categories are enabled starts with a geo-gate given by the user's region; the final say is always the user's.
Categories and their legal classes:
| Category | Description | Class |
|---|---|---|
crash | Crash/error category + code + location (masked) | notice (P) |
usage | Anonymous feature/usage counts, session | notice (P) |
device | Instrument model/brand/bus/range (static) | notice (P) |
performance | Phase timings, compliance aggregate | notice (P) |
device_firmware | Firmware version (identifies the device together with the model) | consent (R) |
error_trace | Masked full stack trace | consent (R) |
- notice (P): Can be bundled with a notice; notice-based default-on is recommended in non-EU regions.
- consent (R): Requires explicit opt-in everywhere; default off.
Geo-gate (sets the initial default):
| Region | Initial default |
|---|---|
| Consent-mandatory (EU-27 + EEA: IS/LI/NO + Switzerland + United Kingdom + Turkey) | All categories OFF — the user turns them on explicitly during onboarding (GDPR/KVKK/ePrivacy) |
| Other regions | notice categories ON (with notice), consent categories OFF |
| Region uncertain | Safe side → treated as consent-mandatory (all off) |
Event → category mapping (gate). Before being sent, every event is passed through a gate that checks whether the category it maps to is enabled. If the category is off, the event is never produced. An event that is not in the list falls into the most restrictive usage category (a safe default instead of a silent leak). Feedback that the user sends deliberately (feedback) is exempt from this gate.
telemetry_enabled flag is derived from the category states (true if any category is on). This lets the send layer look at a single flag while keeping the actual privacy decision in the multi-category consent model. From the Settings > Privacy screen, each category can be toggled individually or all can be withdrawn at once (revoke).3.4. Feedback (feedback)
Feedback is a message that you deliberately write and send — a suggestion, a bug report or a question. Unlike automatic telemetry, you write its content yourself, so it is independent of the consent gates. Like the "write us your thoughts" card in a product's box — the say is yours, and so is whether to send it.
- Why it is done: So the user can reach the developers directly and help shape the software.
- What it teaches / measures: That you can send a message, a category, a 1–5 rating and optional contact information.
- Where it is used: Sending a suggestion/bug/question — from the
Help > Send Feedback / Report a Bug...menu.
Feedback is a message the user sends intentionally and is evaluated independently of the telemetry consent gates.
| Parameter | Unit | Description | Default / limit |
|---|---|---|---|
message | text | The message written by the user | ≤ 5000 characters |
category | — | Category (whitelist) | suggestion, bug, question, other |
rating | integer | Satisfaction rating | 1–5 or none |
contact | text | Contact for a reply (optional) | — |
message and contact are entered intentionally by the user, PII stripping (deny-list) is not applied — otherwise the name/email the user wrote themselves would be discarded. Even so, mask_pii is applied to guard against path/user-name leakage. Feedback menu: Help > Send Feedback / Report a Bug....4. Safety (Hardware Safe-state)
This system guarantees that on every path that talks to the instrument, the highest priority is to bring the hardware to a safe state. There are three pillars: pre-measurement validation + current compliance, the safe-state sequence, and E-STOP (emergency stop).
4.1. Pre-measurement validation and current compliance
This mechanism checks that all parameters are within safety limits before any measurement starts; in addition, "compliance" (the current ceiling) places an upper bound on the current the instrument will apply, protecting the sample and the instrument. If any setting exceeds a limit, the measurement does not start at all. Like a fuse cutting the circuit on overcurrent — it stops before any damage occurs.
- Why it is done: To prevent a wrong parameter from burning the sample or straining the instrument.
- What it teaches / measures: The voltage/current/power limits and that when the current ceiling is reached at a point (
compliance_hit), the measurement ends safely. - Where it is used: Before every measurement on a real bench — pulling the limits down to your sample's true limits is vital.
No sweep starts before its parameters are validated. Validation (validate_common_limits) applies the following rules:
| Check | Rule | Error |
|---|---|---|
| Step count | step_count > 0 | "Step count cannot be zero or negative." |
| Averaging | averages >= 1 | "The averaging count must be at least 1." |
| Compliance sign | drain and gate compliance > 0 | "Current compliance must be positive." |
| Compliance ceiling | compliance <= max_current_compliance | "Current compliance is above the safety limit: … A" |
| Voltage limit | |voltage_limit| <= max_abs_voltage | "Voltage limit is above the safety limit: … V" |
| Power limit | power_limit > 0 | "Power limit must be positive." |
In addition, every voltage value to be applied is checked individually against max_abs_voltage (ensure_voltage_values_safe): if any value exceeds it, the measurement is rejected before it starts.
The safety limits come from the safety_limits block in config/default_config.json:
| Parameter | Unit | Description | Default |
|---|---|---|---|
max_abs_voltage | V | Maximum allowed absolute voltage | 1.000.000 |
max_current_compliance | A | Maximum allowed current compliance | 1.000.000 |
max_power | W | Maximum allowed power | 1.000.000 |
max_abs_voltage=60, max_current_compliance=0.01, max_power=0.5.Compliance hit (compliance hit). If, at a measurement point, the instrument reaches its set current compliance, this is marked as a compliance_hit, written to the data, and the measurement is ended safely. On the telemetry side, these hits are reported as an aggregate at the end of the sweep (total hit count + first-hit step) — the hot loop is not touched.
4.2. Safe-state sequence
The safe-state sequence neutralizes the hardware in a definite and invariant order at the moment of an error, abort or shutdown: first it turns off the source (the SMU output), then it opens the relay. This order matters, because cutting the energy first and then disconnecting the line is the safest path. Like switching off a device's button before pulling it from the wall — the reverse order can cause a spark.
- Why it is done: To guarantee that the hardware definitely stays safe on every termination (normal or crash).
- What it teaches / measures: The "de-energize first, then switch" principle and that this hook runs on crash/exit too.
- Where it is used: At every measurement end, abort and unexpected crash — in the background, without the user even noticing.
On an error, abort, or application shutdown, the hardware is brought to a safe state in a definite sequence. This sequence is based on the principle of cutting the source first and then switching (de-energize first, then open its relay).
1. SMU output OFF              (Keithley/Keysight/R&S SMU output OFF)
2. Switch Matrix relay OFF     (relay OFF — e.g. switch matrix command `a`)
3. Safe closing of connections
At the code level, this is provided by safe_shutdown:
- First
smu.output_all_off()is called (in atryblock). - Then (in
finally), if the context isNoneorrelay_enabledis true,relay.all_off()is called. So the output is turned off in every case; the relay is only opened when relevant.
Crash/exit coverage. The same safe-state callback runs on interpreter exit (atexit) and on an uncaught exception too (device_safety). The order is: hardware safe first, then the existing hook chain (telemetry/log). This complements the Qt closeEvent path: non-Qt, headless or abnormal terminations are also covered. The safe-state hook swallows its own errors and never crashes the exit/reporting chain.
safe_off verification is a separate bench (BENCH) step.4.3. E-STOP (Emergency Stop)
E-STOP is the large "emergency stop" button that instantly brings all registered hardware to a safe state with a single click. It first stops the running measurement workers, then turns off the device outputs; even if one device errors, it keeps safing the others. Like the red emergency-stop mushroom button on a machine — you press it without thinking, and everything stops.
- Why it is done: To stop everything instantly to protect the person and the hardware when something goes wrong.
- What it teaches / measures: Which devices were/were not safed (EStopResult) and that it runs only once even if the operation is repeated (idempotent).
- Where it is used: Emergencies — but always keep a separate physical emergency stop for sources outside the software.
The E-STOP button ("ACİL DURDUR" / EMERGENCY STOP) is a prominent control that brings all hardware to a safe state instantly. Unlike other hardware widgets, E-STOP does not emit an intent and wait for its owner to act; the moment it is clicked, it directly runs the safe-all operation, but it emits the result (output per target) afterward.
Trigger sequence (H3 guarantee): trigger() runs in two phases and does not short-circuit in any phase (one target's error does not stop the others):
Phase 1: All worker-stoppers   (QThread workers are stopped and joined first)
Phase 2: All device safe-functions (hardware output-off comes second)
This order prevents the GUI thread and a lagging worker from accessing the same SMU concurrently (stop the worker first, then apply output-off on the hardware).
Safe-state method selection. The controller calls the first found safe-state method of each device in priority order:
output_all_off > all_off > safe_state > safe_offWhen a RoleBinding (role binding) is registered, the order matters: smu → relay → thermometer. That is, the source (SMU) is secured before the relay. A device that offers none of the known safe methods (for example a temperature controller that has not yet gained safe_off) is skipped and its name is returned to the caller; this way the gap surfaces in advance instead of being a surprise on the bench.
Result (EStopResult):
| Field | Description |
|---|---|
safed | Names of the device targets secured without error |
failed | (name, error message) — for each failed target |
stopped_workers | Names of the worker-stoppers run without error |
ok | True if failed is empty (all targets OK) |
The interface shows a message based on the result: if all are safe, "Emergency stop: all devices safe."; if some could not be secured, "Emergency stop: some devices could not be secured."
Other important behaviors:
- Idempotent: After E-STOP has fired once, repeated triggers (e.g. a top-bar click followed by the
closeEvent's emergency-stop call) are no-ops; the worker-stoppers/safe-functions do not run twice. It is set up again withreset()for a new measurement. - Accessibility (a11y): The button's accessible name is updated according to its state: "EMERGENCY STOP — armed (outputs ready to stop)" (armed) or "EMERGENCY STOP — active (stop in progress)" (live). Screen readers announce this state.
- Visual pulse (pulse): The button blinks with an opacity pulse to draw attention — slow in the armed state (1800 ms, 1.0→0.70), fast when active/during measurement (600 ms, 1.0→0.45). If the user prefers reduced motion (Windows accessibility setting / Qt), the animation is not created at all.
- Crash coverage: The same safe-all is bound to
device_safetyat startup; this way it runs on a crash / uncaught exception / exit too.
4.4. Calibration reminder
The calibration reminder tracks the time elapsed since the last calibration date and, when the interval you set (typically 365 days) is reached, logs a warning at startup. It does not block measurement; it only reminds you that "it is time to send your instrument back for calibration". Like your car's "service time" warning light.
- Why it is done: To maintain the traceability of measurement accuracy and not overlook an overdue calibration.
- What it teaches / measures: The number of days remaining until calibration; an "overdue" warning if negative.
- Where it is used: Quality control and accredited measurement — for laboratories that require regular calibration.
Taking the reminder feature of bench tools (e.g. BenchVue) as a model, the software logs a warning at startup when recalibration is overdue. The calculation is pure date arithmetic (no I/O, does not block startup).
| Parameter | Unit | Description | Default |
|---|---|---|---|
calibration_reminder_enabled | — | Whether the reminder is enabled | false |
calibration_last_date | ISO date | Last calibration date (YYYY-MM-DD) | "" |
calibration_interval_days | days | Calibration interval | 365 |
Days-remaining calculation (days_until_calibration_due):
input  : last_date (ISO), interval_days, today (today)
formula: remaining = (last_date.ordinal + interval_days) - today.ordinal
output : remaining (days)   — a negative value = overdue
special: last_date empty/invalid OR interval_days <= 0  ->  None (no reminder)
At startup, if the reminder is enabled and remaining < 0, the following warning is written to the local log:
WARNING | Calibration overdue by <N> day(s)Setting location: Settings > Hardware > Calibration.
Summary: Quick Reference
| System | Location / Access | Key file/endpoint |
|---|---|---|
| Local log | %APPDATA%\…\logs\tft_measurement_app.log (5 backups, ≈2 MB/file, UTC) | — |
| Output Log console | Bottom dock; View > Log / Console | color-coded, local time |
| Diagnostic package | Zip export (secrets redacted) | system_info.json + logs/* |
| Self-test | Hardware page > device card action menu | read-only, PASS/WARN/FAIL |
| Troubleshooting | Diagnostic band > "Troubleshoot" | 5 steps + one-click fix |
| Telemetry queue | Data root | telemetry_queue.jsonl (offline-first) |
| Privacy/consent | Help > Privacy and Telemetry... | 6 categories, geo-gate |
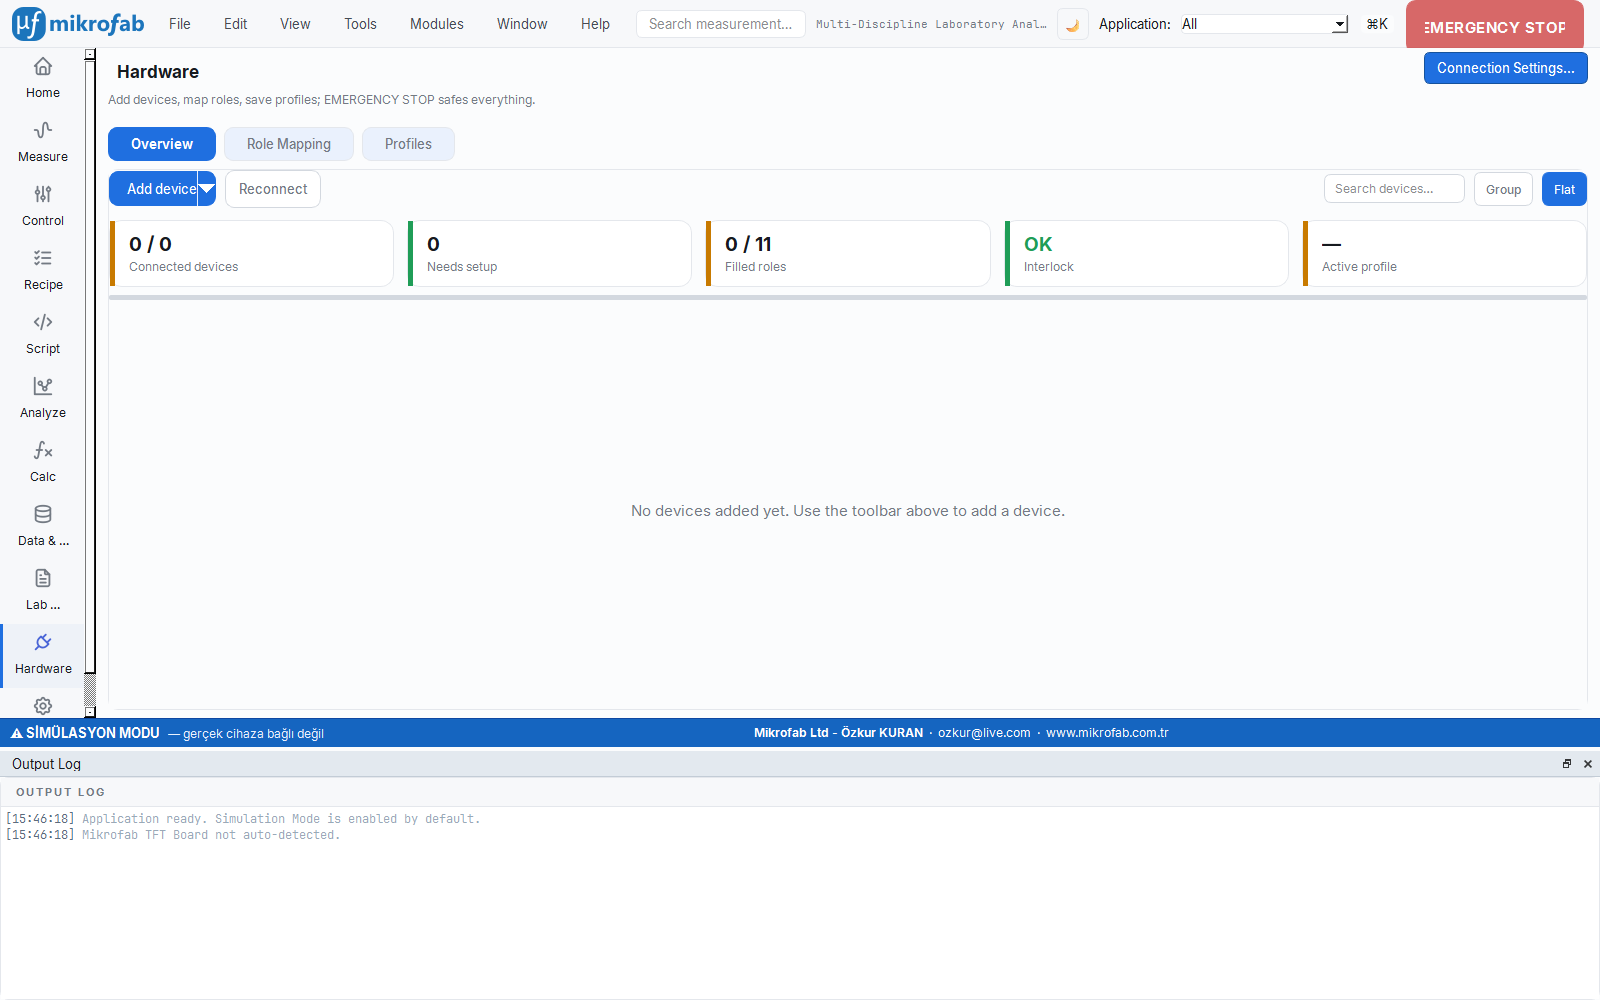
| E-STOP | Top bar "EMERGENCY STOP" | worker→SMU→relay, idempotent |
| Calibration | Settings > Hardware > Calibration | startup warning |