From measurement to report, one professional interface
Mikrofab Suite brings semiconductor/TFT, photovoltaic and materials characterization together in a single application. From data generation to traceable reporting, and on to overnight automation, every step shares the same discipline: deterministic output, a sha256 integrity seal, and the “missing ≠ zero” principle. Below you can explore the product's main feature families in depth.
Unified measurement workspaces
From TFT/diode I-V and transfer sweeps to photovoltaic J-V, from LCR/impedance to resonant spectroscopy, every measurement mode is gathered in a single, categorized gallery. Each measurement is automatically committed to a traceable record.
Descriptor-driven analysis
Vth, SS, mobility, FF/PCE, EQE, NEP/D* and more. Every metric is presented with uncertainty on the GUM line (value ± U, k, n); a reliability badge clearly flags the validity of the result.
Traceable reporting
A canonical (JSON) record is produced first, and all HTML/PDF presentations are derived from it. One model, many formats: the number you see on screen is always identical to the number that gets archived.
Lab Journal (ELN)
A sample-centric electronic lab notebook. It keeps fabrication steps as cards, attaches images, and bridges the sample to its measurement results — process history and electrical outcome in one place.
Automation & REST API
Recipe-based workflows, headless overnight tests, a local REST API and a fully programmable Python console. Scan an entire wafer with a single launch.
Multi-vendor hardware
Keithley, Keysight and Rohde & Schwarz SMUs, a Switch Matrix relay card and an extended inventory. Start without connecting any hardware: simulation mode is built in.
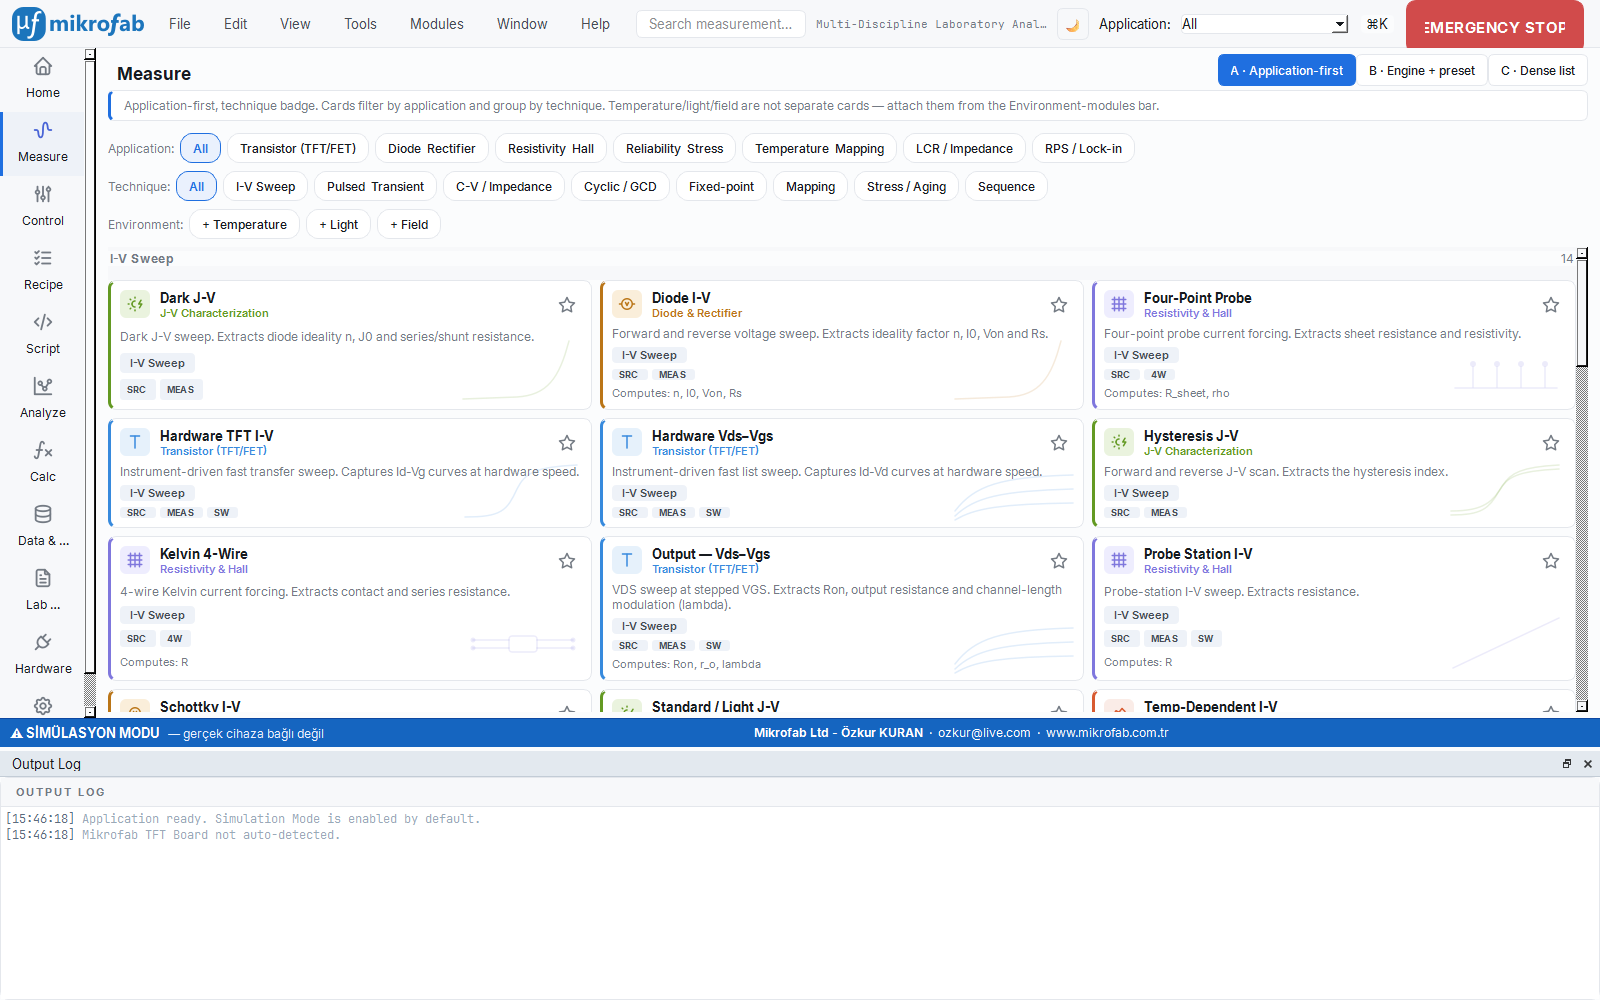
Unified measurement workspaces
The measurement page gathers all measurement modes into clickable cards organized by category, just like the R&D page: semiconductor/TFT, photovoltaic, LCR/impedance and resonant spectroscopy. You pick a mode, enter the parameters, and watch the curve live. When the measurement finishes, a traceable record is committed to disk without pressing an extra button.
- Automatic recording. Every run is written to its own subfolder; raw data in CSV/TXT/XLSX, the canonical report (JSON/CSV) and free-form metadata are produced together.
- Crash-resilient writing. During long measurements (bias-stress, recipe) each point is written immediately to
*_partial.csv; even if power is lost, the data collected up to that moment is preserved. - The right schema per measurement family. The TFT, two-terminal, PV, four-point and endurance families each select their own columns (unit + type); a solar-cell report no longer looks like a “transistor report.”
- Multiple devices via recipe. With Switch Matrix relay automation you can sweep many devices on a wafer sequentially with a single launch.
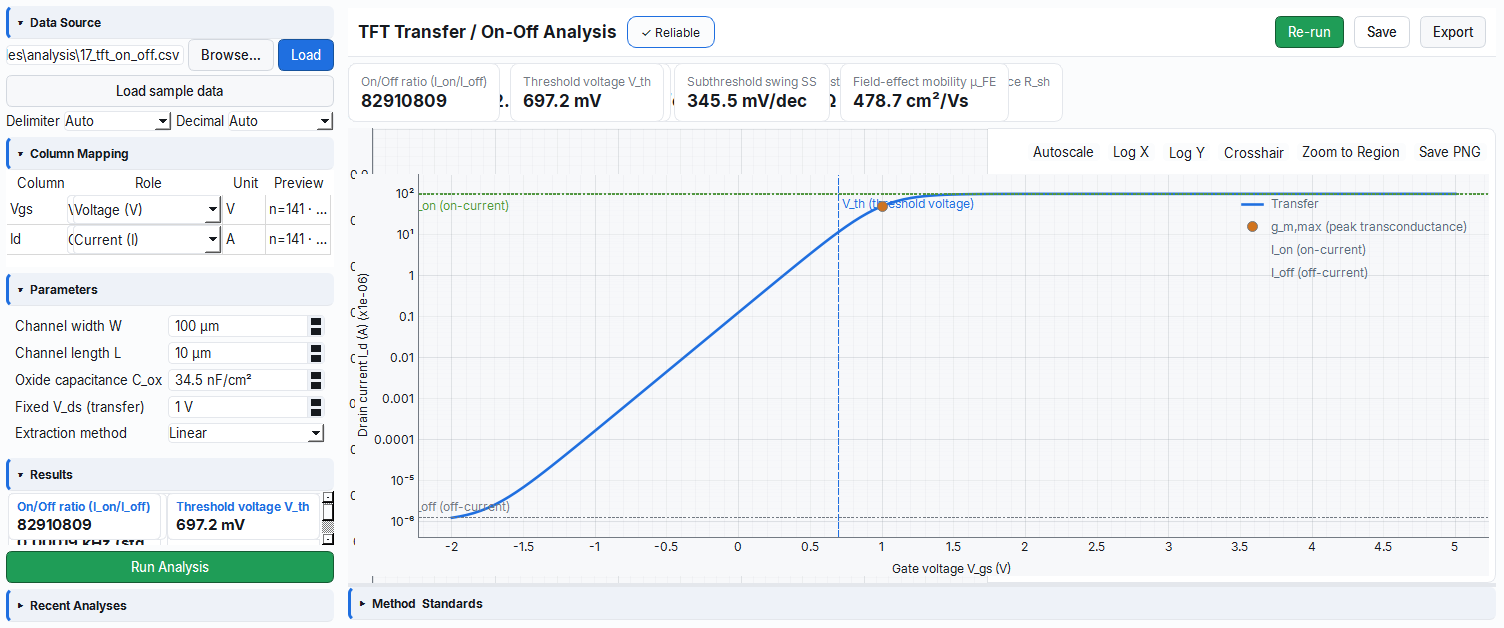
Descriptor-driven analysis and the reliability badge
The analysis workspace extracts metrics from the data file you load. Each analysis module is described by a descriptor: it is explicit about which metrics, which method, which standards and which conditions it carries. This keeps the output language-independent, auditable and reproducible.
- GUM uncertainty. Metrics are presented in the form
value ± uncertainty; the expanded uncertaintyU = k · u_stdand the coverage note (k,n) are kept together with the raw fields. - Reliability verdict. Every result is clearly labeled: Reliable, Not reliable or Outside STC. Quality is visible at a glance.
- Standard references. The relevant measurement standard (designation/title/edition/scope) is carried into the report via the descriptor.
- Safe export. If an analysis is not reliable, confirmation is requested before the report (JSON/PDF) is written; an unreliable result is never accidentally exported as an official report.
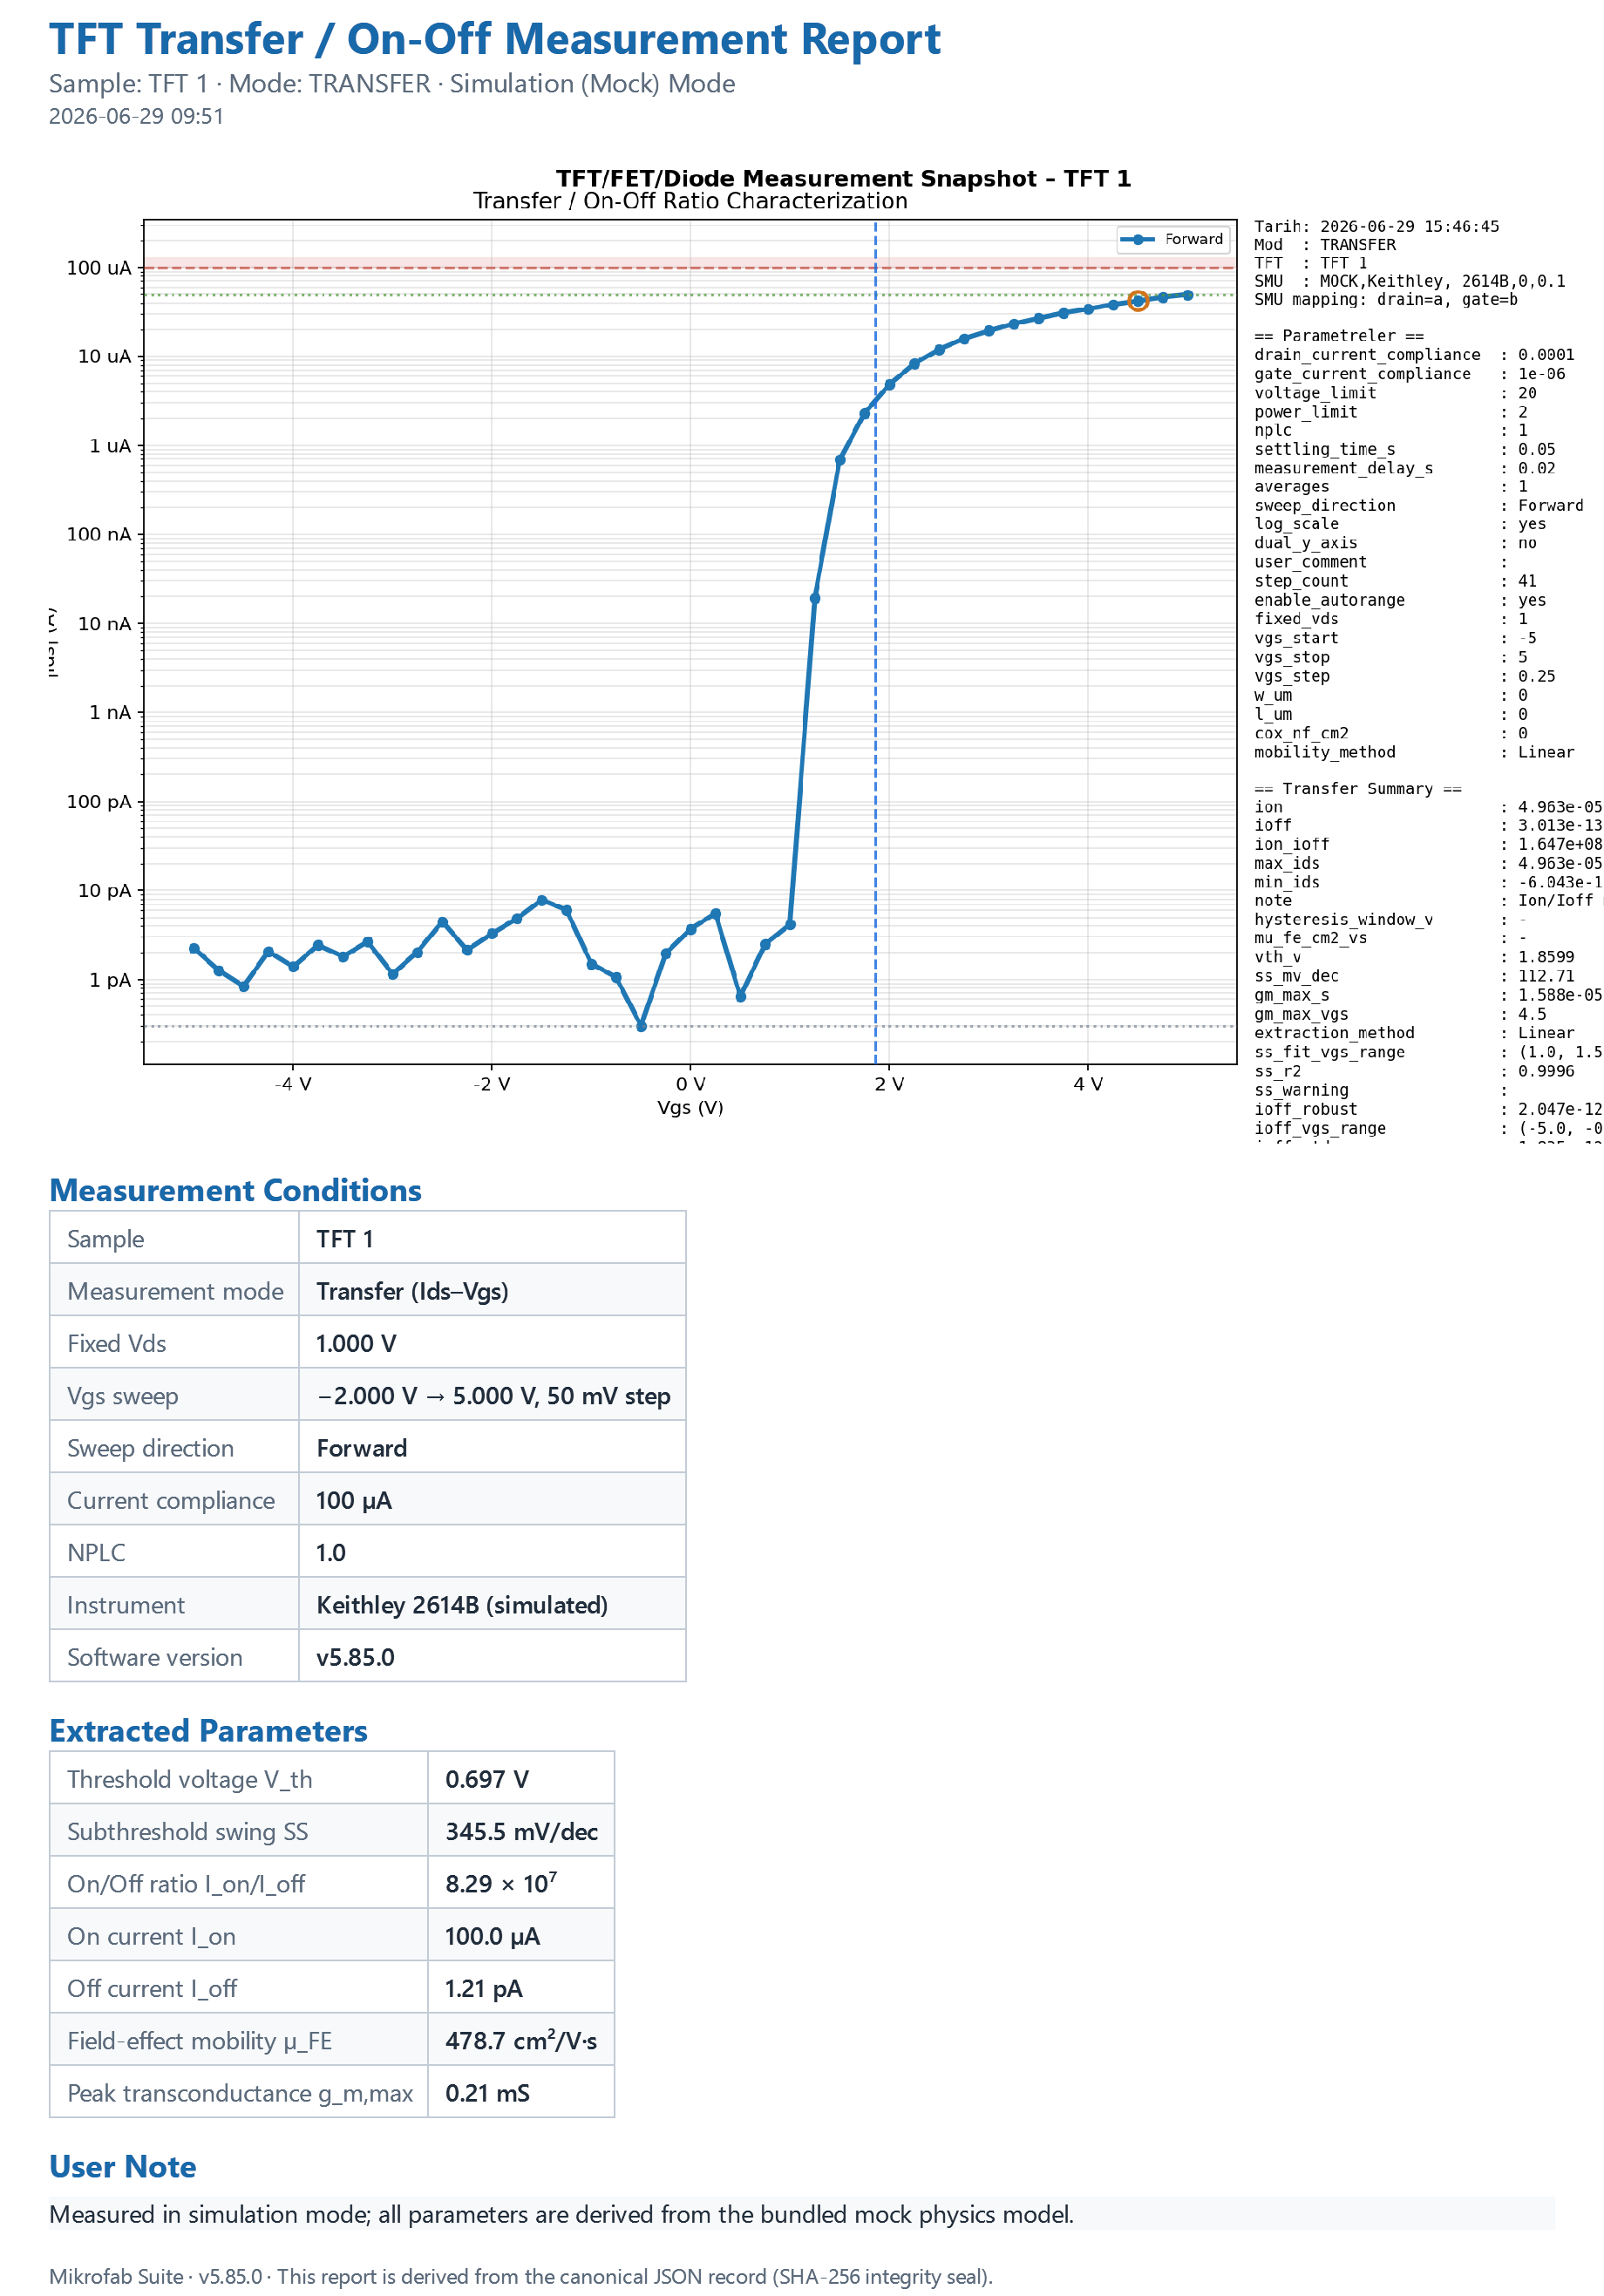
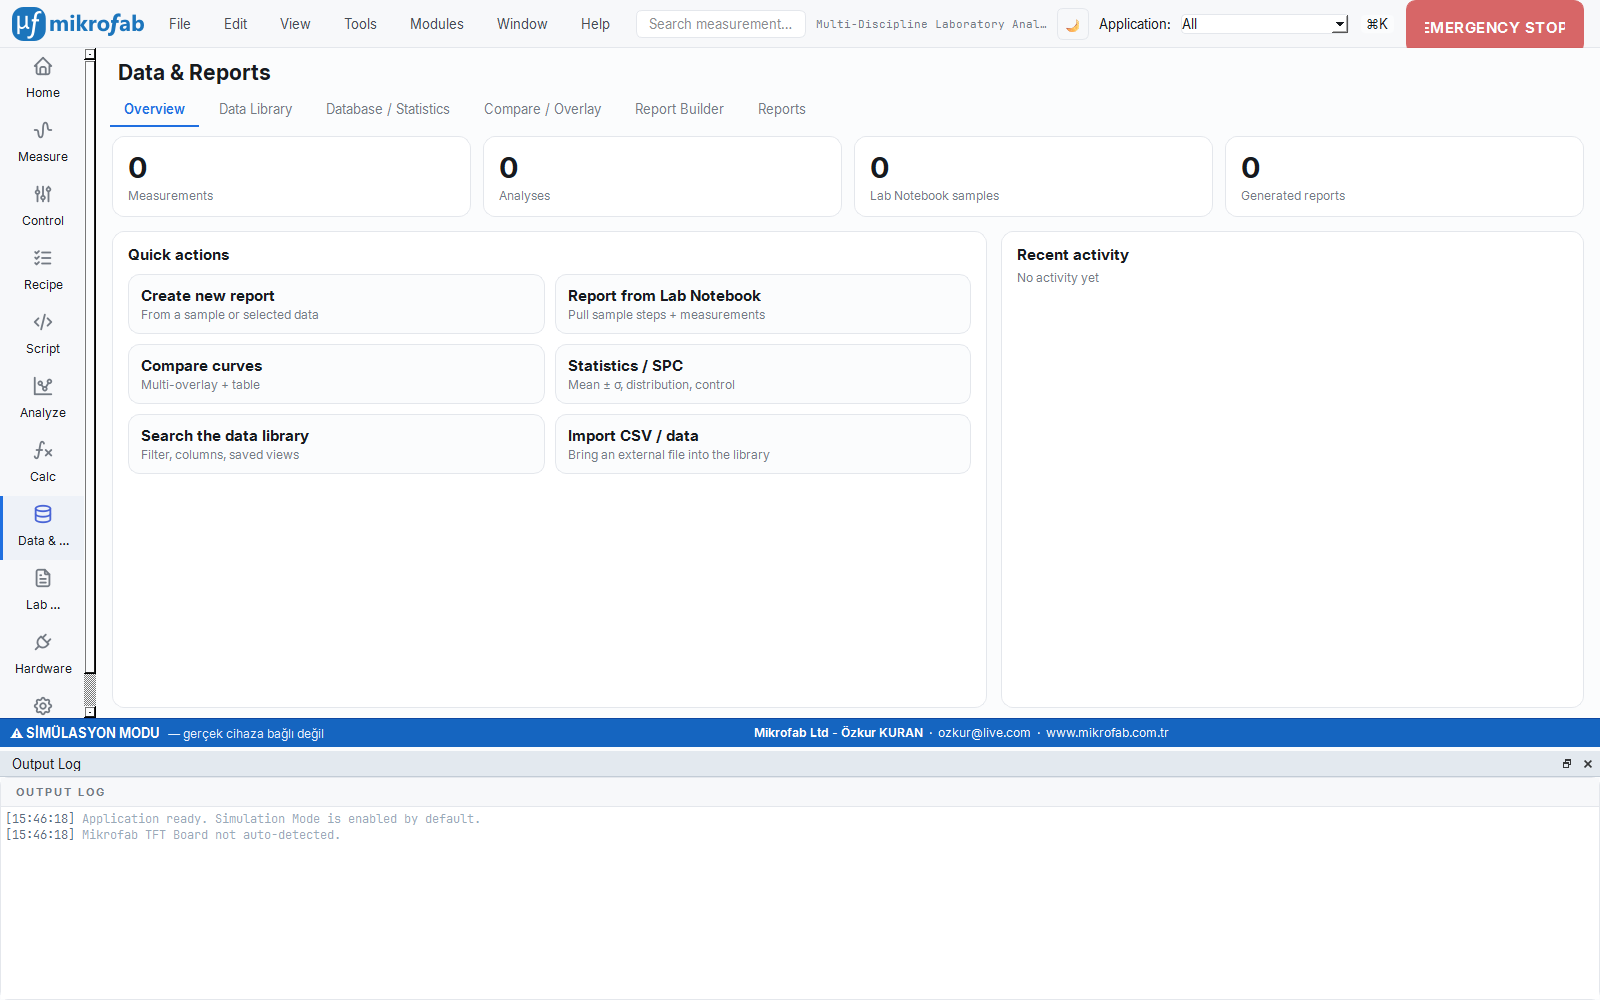
Traceable reporting and export
A report is the official, traceable record of a measurement. A canonical (machine-readable, tamper-evident) JSON object is produced first; all human-facing presentations (HTML, PDF, on-screen tables) are derived from this single object. The format may change, but the data does not.
- Integrity seal. Every canonical report carries a
sha256digest; if the file is later modified, it becomes apparent. The same report always yields byte-identical output and the same checksum. - “Missing ≠ zero.” An unmeasurable value is never filled in with
0, but written asnull; a run that was interrupted is shown withstatus:"partial"and is never presented as “completed.” - Three-level provenance. Reports carry a traceability header (instrument, sample, version, time) at the
base/customer/accreditedlevels. - Rich export. Canonical CSV (locale-independent) + Excel-compatible CSV, TXT, XLSX (two sheets), JSON and a plot PNG. PDF is produced with Qt, without extra dependencies.
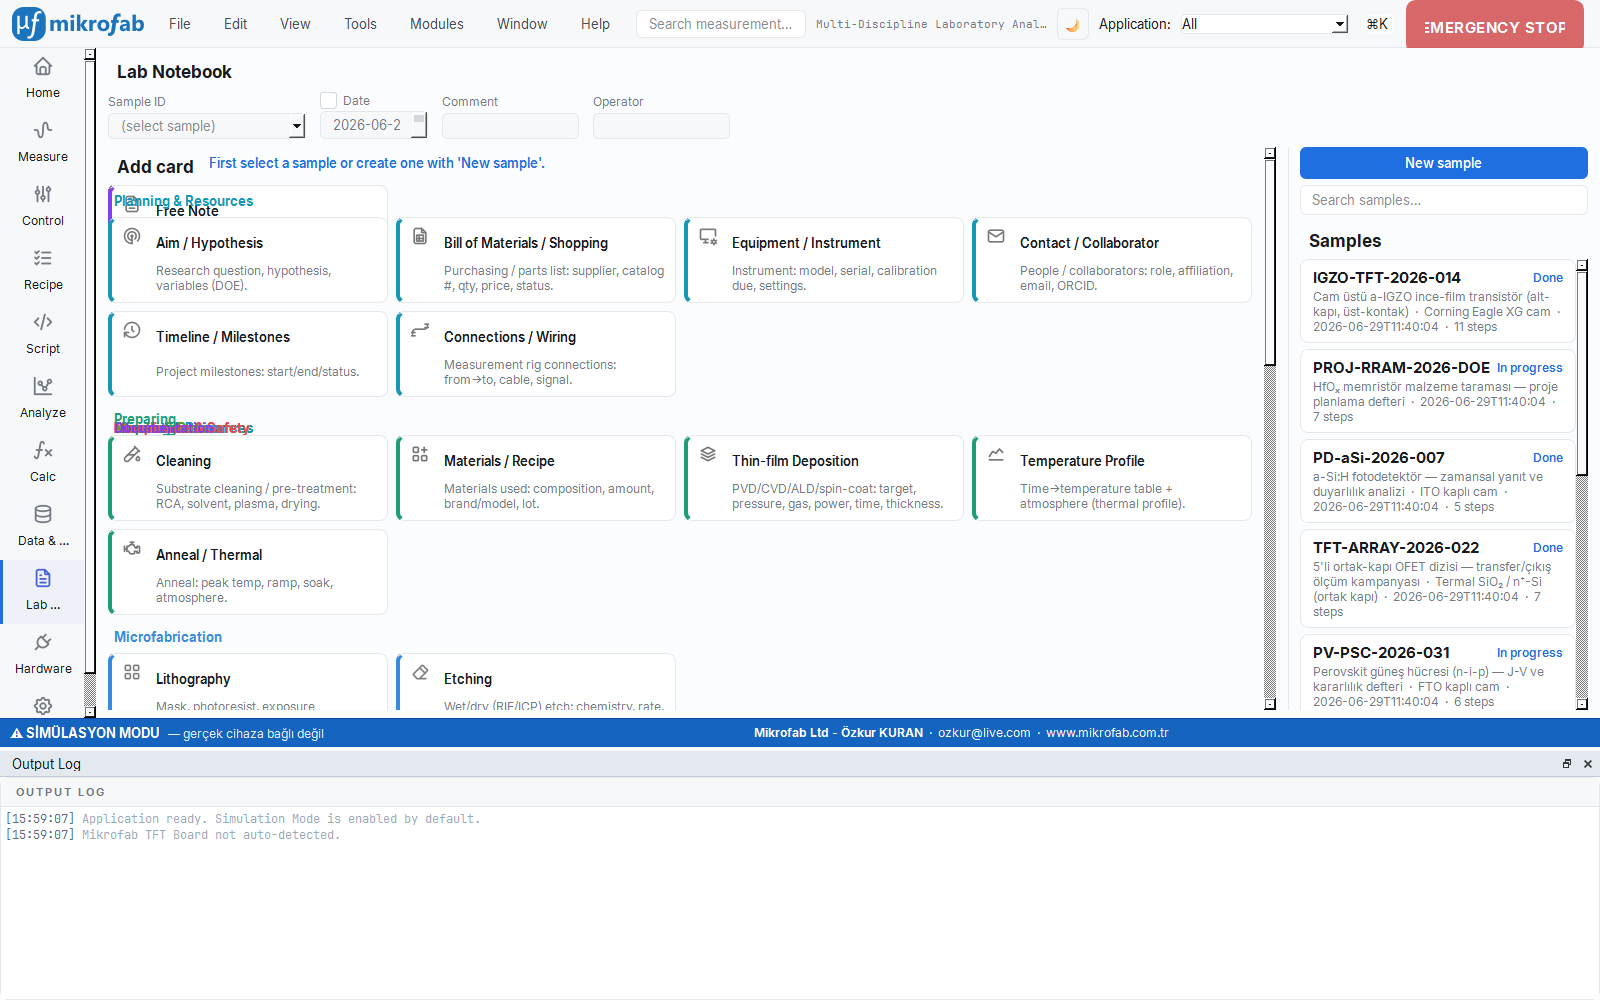
Lab Journal / Electronic Lab Notebook (ELN)
The Lab Journal is a sample-centric electronic lab notebook. When you fabricate a material/sample, it records the fabrication steps (cleaning, thin-film, lithography, etching, annealing, measurement, note…) as cards, attaches images, and lets you link this application's measurements by sample ID.
- Unified Sample ID. The base name, date, comment and operator fields merge live into a single DB-safe ID (e.g.
TFT-ZnO-2026-06-22-rev1). - Rich step types. Cards organized by category, from core process steps (lithography, annealing, measurement) to R&D extensions (XRD, microscopy, spectroscopy, safety, signature).
- Measurement bridge. The sample ID corresponds to the
tft_idfield of measurements; ameasurementcard links directly to a measurement record in the database. Process history and electrical outcome come together. - Audit and durability. Every create/update/delete is written to the audit trail with who and why; soft-delete and pre-migration backup lay the foundation for an accredited (ISO 17025 / 21 CFR Part 11) regime.
Recipes, headless mode and the REST API
Manage the entire flow, from a single measurement to overnight automation and remote control. The automation chain is safe and auditable: recipes are JSON, and no step carries executable code.
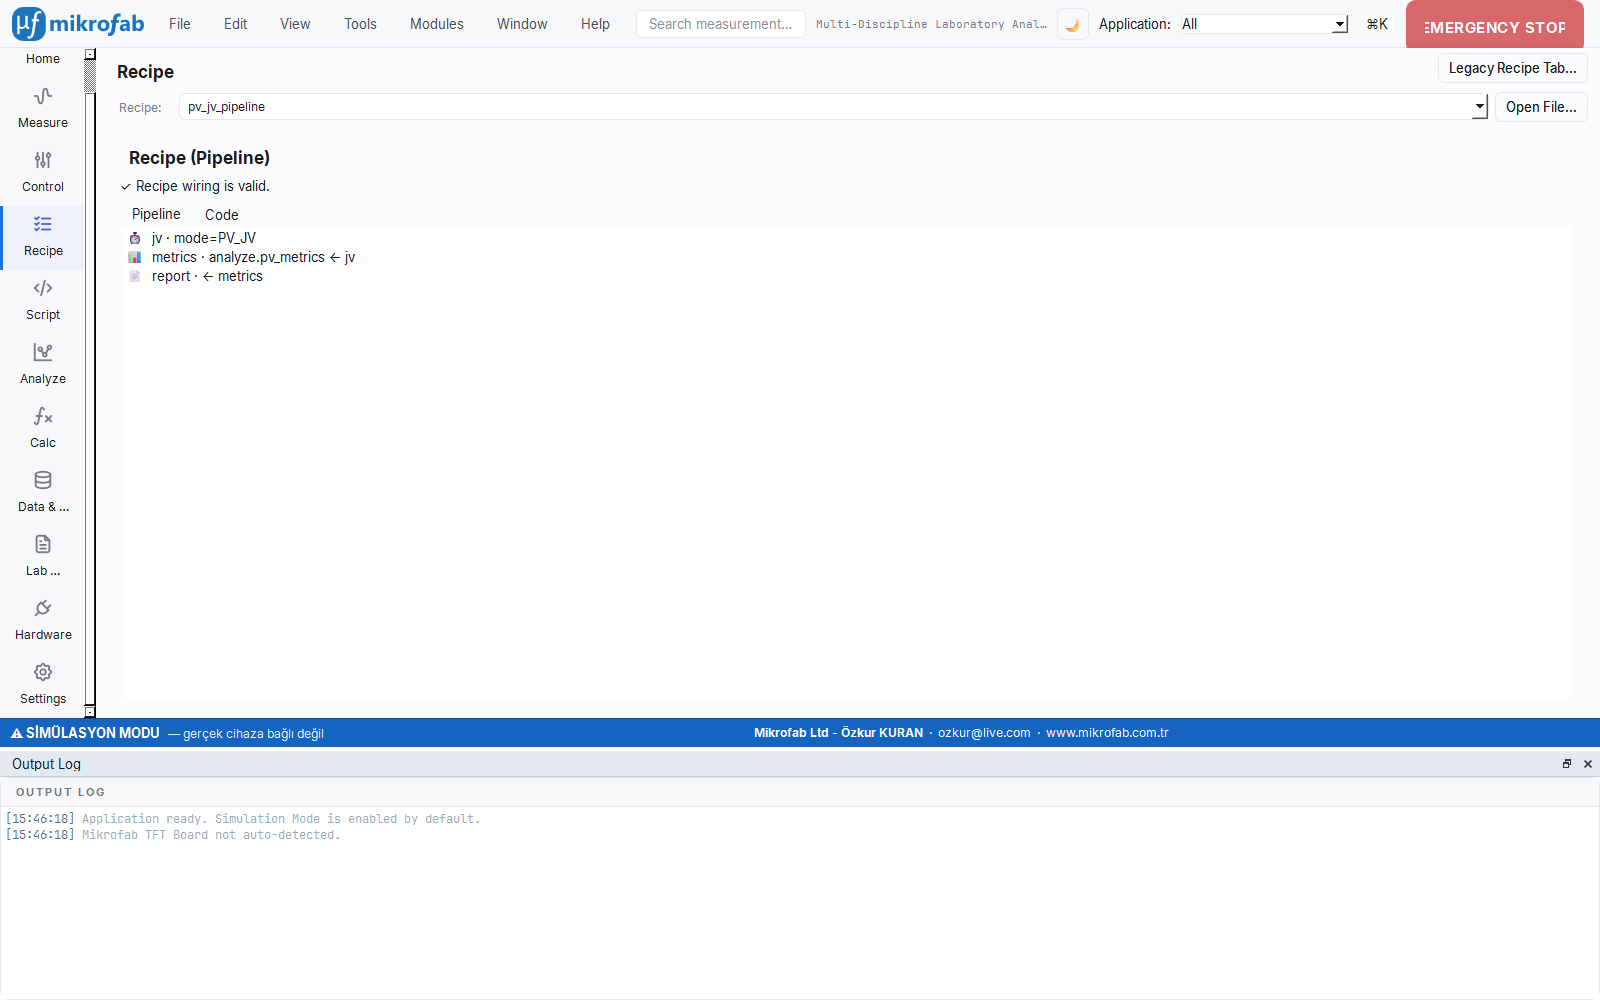
Recipes and overnight tests
A recipe runs multiple measurements as an automated sequence. The modern pipeline consists of sequentially linked, type-distinct steps that treat data as the single source of truth:
- Cross-domain pipeline. The Measurement → Analysis → Calculation → Report steps are linked by name; the wiring is validated at load time.
- Classic stability recipe. The Transfer-Before → Bias-Stress → Transfer-After flow extracts the threshold shift (ΔVth); it is repeated for each selected TFT.
- Overnight tests. In headless mode, set up hours-long stability runs with
--repeat/--interval; thanks to crash-resilient writing, data is preserved even if power is lost.
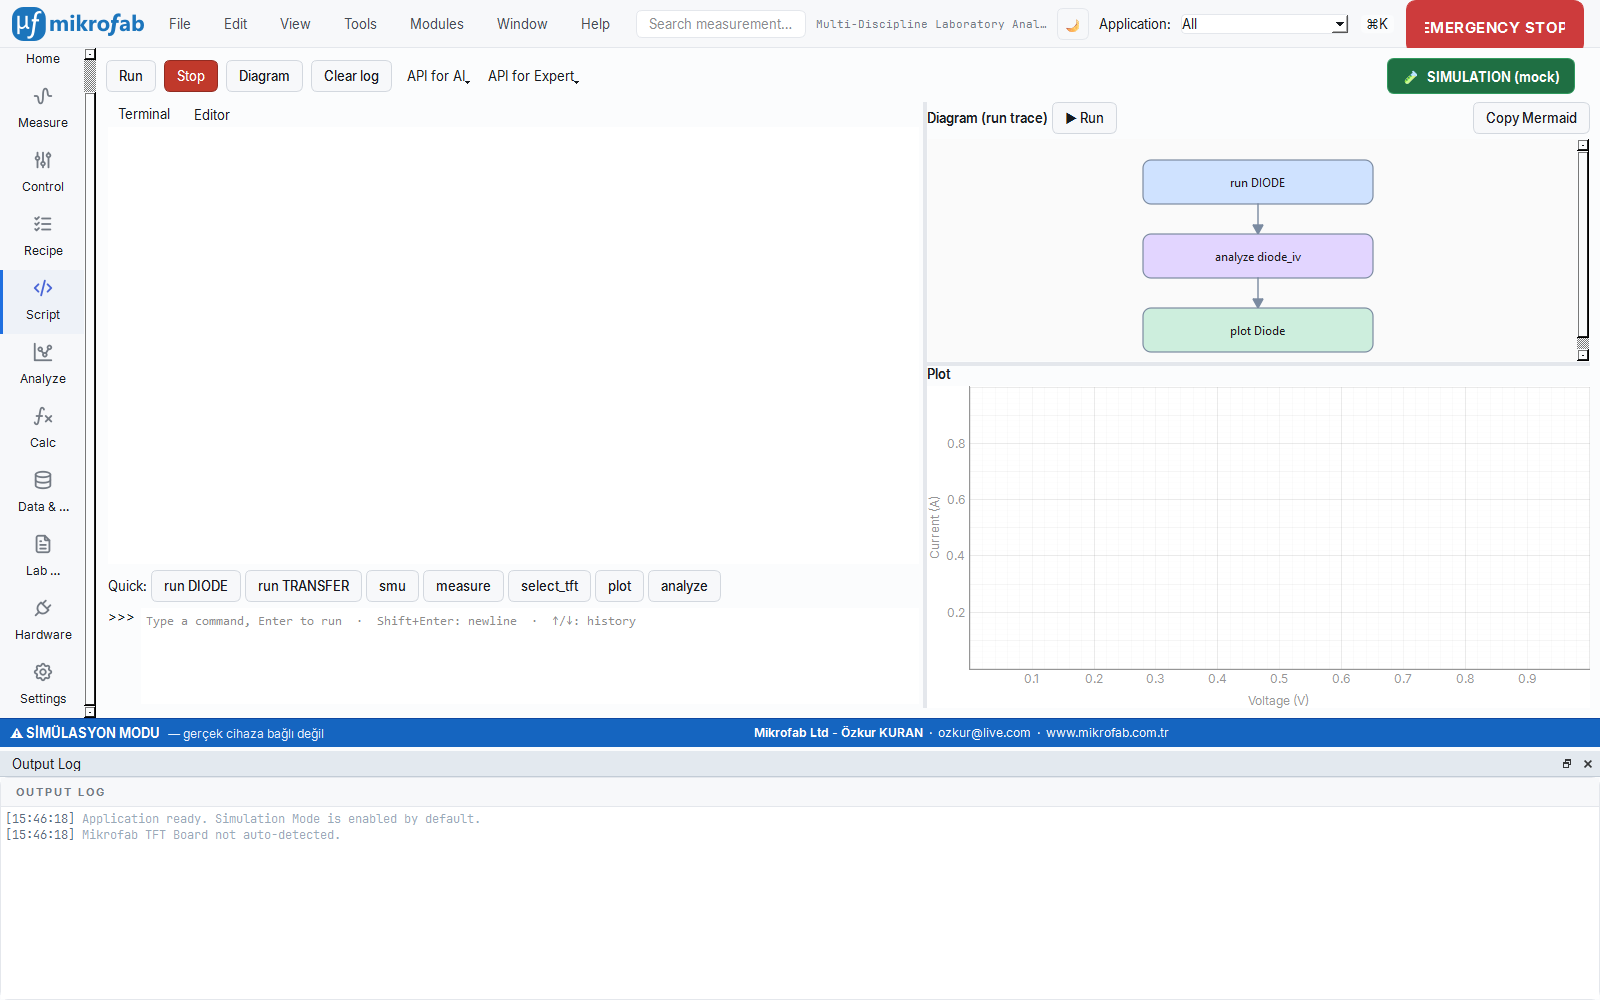
Headless, REST API and the Python console
Run measurements without opening the GUI, define a job JSON, or drive the running controller over HTTP. A Python scripting surface offering full programmability to experts and R&D is also built in.
- Headless mode. Recipes, timed repeated measurements and remote control via
python main.py --headless --job recipe.json. - Local REST API. With
--serve, endpoints that use only the standard library and by default bind to localhost only:/health,/status,/data/live,/measurement/start,/measurement/stop. - Python Script / Console. A persistent-session terminal + editor;
run(),analyze(),plot()calls. With “API for AI” and “API for Expert” you can export the definition and have an LLM write the script.
127.0.0.1 only. If network access is required, provide an explicit address with --host, but always keep it behind a trusted network / VPN / reverse proxy. Reports, on the other hand, are never sent anywhere automatically — reporting is entirely separate from telemetry.Multi-vendor hardware, Switch Matrix and simulation
The hardware layer is built on a multi-vendor instrument registry. If a device is registered, it is recognized automatically from its *IDN? response, and the correct protocol and channel count are assigned. Set it up in simulation first, then move to the real bench with the same interface.
- Broad device support. Keithley 2400/2600 (SCPI & TSP), Keysight B2900 and Rohde & Schwarz NGU/NGM SMUs; plus PSU, LCR, AWG, lock-in and temperature controllers.
- VISA discovery. Read-only automatic discovery over USB/GPIB/LAN/RS-232; every I/O is bounded by a timeout, and an unresponsive device is polled less frequently with exponential back-off.
- Switch Matrix. A 16-channel relay card; token + SCPI command layers, an “all-off” safe command and closed-loop route verification via
verify_route— bias is never applied to the wrong channel. - Role abstraction. 11 canonical capability roles, role mapping and named station profiles; an instrument console and safe firmware update.
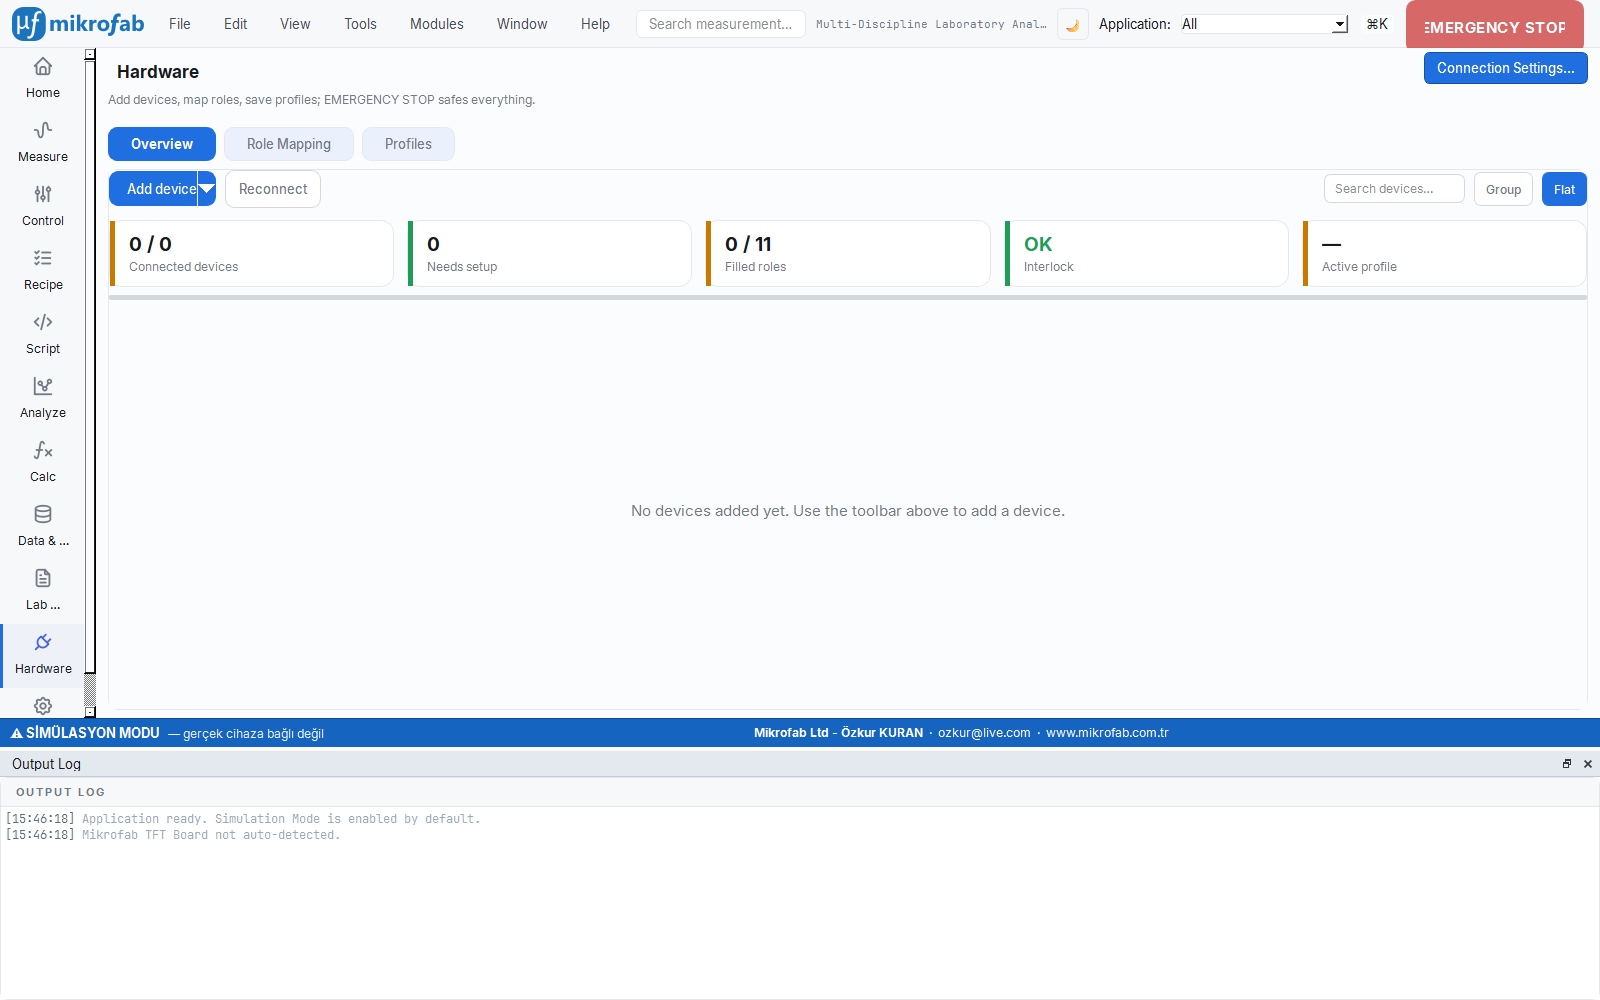
Start without hardware
The software opens in simulation (mock) mode by default. The canonical physics-mock driver generates diode, Schottky, solar-cell and transistor physics. You can try the entire workflow (discovery, adding, role assignment, console, measurement) without connecting any device.
Always a safe shutdown
On error, cancellation or shutdown, outputs are brought to a safe value: SMU output OFF → all Switch Matrix relays open → connections closed safely. This sequence runs not only on a normal shutdown but also on an unexpected termination.
Timeout enforced
Every read/write/query sent to a device is performed with a bounded timeout; there is no infinite/blocking wait. After SCPI/TSP operations the error queue is checked; errors are not swallowed but surfaced meaningfully.
For manufacturing and R&D, and for academia too
The same software serves different teams through a User Mode (Operator / Expert / Developer) that scales to your role.
R&D and production labs
- Audit-ready records with traceable, sha256-sealed reports
- High-volume, repeatable sweeps with Switch Matrix + recipes
- Integrated automation with headless overnight tests and the REST API
- Bringing a multi-vendor bench together in a single inventory
Researchers, students and education
- Risk-free learning and demos with hardware-free simulation mode
- Sound methodology with descriptor-driven analysis + GUM uncertainty
- A record of the sample life cycle with the Lab Journal (ELN)
- Publication- and thesis-ready output with standard-referenced reports
Try the features with your own data
Mikrofab Suite runs without hardware in simulation mode — you can explore every feature right up to installation. For a detailed walkthrough, take a look at the step-by-step user manual, or request a demo tailored to you.